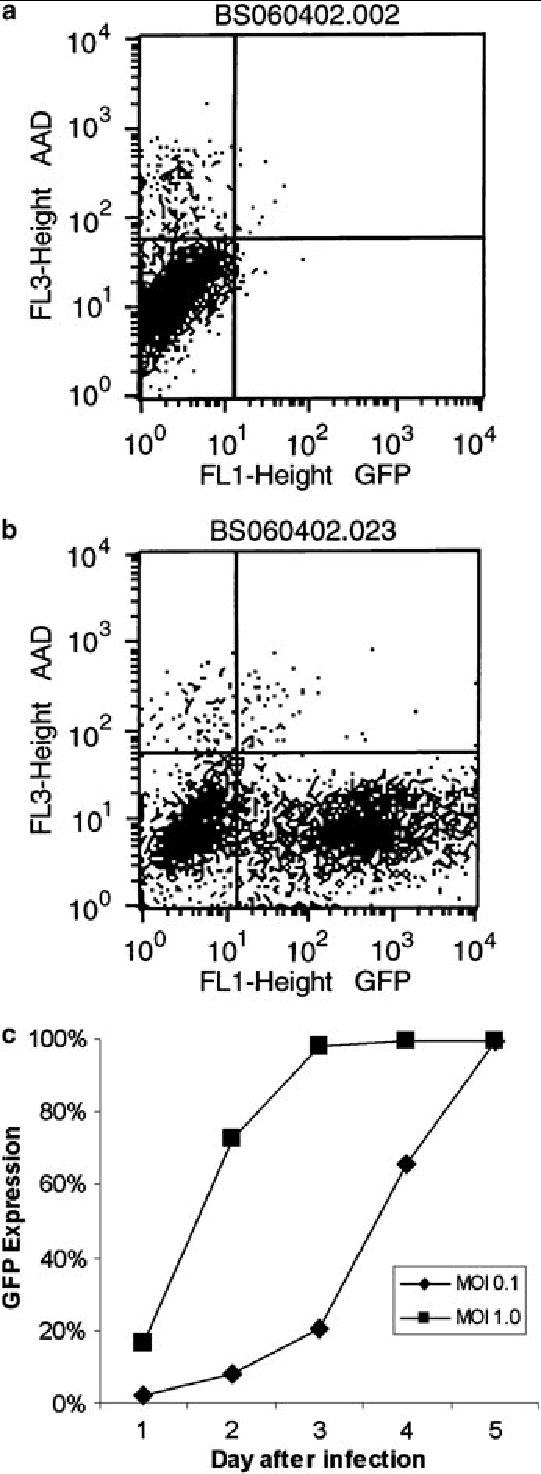
Figure 2.

EGFP expression. Following treatment with NV1066, infected A549 cells express EGFP, as determined by flow cytometry. The lower right hand quadrant of (A) and (B) represent live cells expressing EGFP. Control populations of cells did not express significant amounts of the reporter protein (A). Over 60% of cells infected with NV1066 at an MOI of 1.0 expressed EGFP after 48 hours (B). Represented as percent of live cells expressing EGFP over time (C), expression increased to nearly 100% with both MOIs after just five days, indicating that nearly all of the cells within the population were infected with NV1066.
