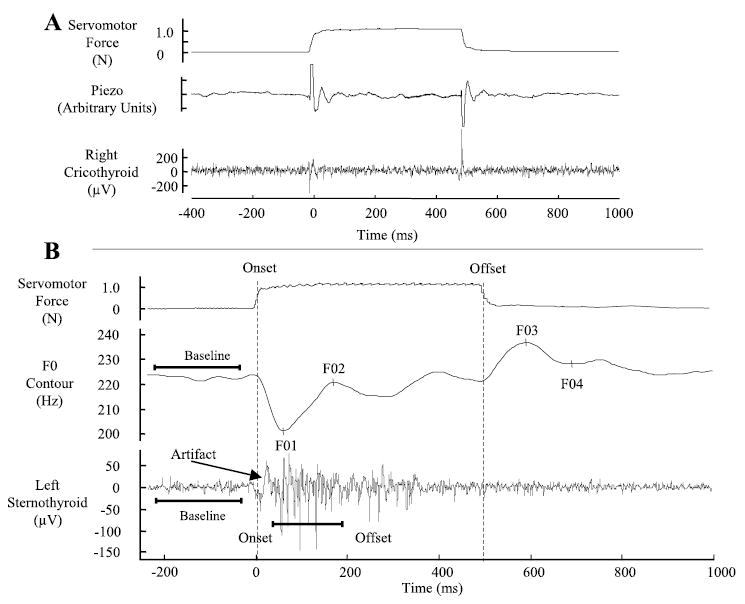
Fig. 1.

A: example waveforms showing the effect of the perturbation on thyroid cartilage position from a single trial in the rest condition. The top tracing shows the servomotor force signal to indicate stimulus onset and offset points. The second tracing shows the piezoelectric acceleration signal. The third tracing shows the effect of the stimulus on the cricothyroid muscle recording. A movement artifact of opposite polarity is present at stimulus onset and offset in the muscle recording. B: example waveforms showing the servomotor force signal, fundamental frequency (F0) contour, and sternothyroid (ST) electromyographic (EMG) signal from a single trial in the high-pitch condition. The servomotor force signal is in Newtons (N). The F0 contour in Hertz (Hz) has the four F0 events labeled as F01–F04. The ST recording is in microvolts (μV).
