
Fig. 4.
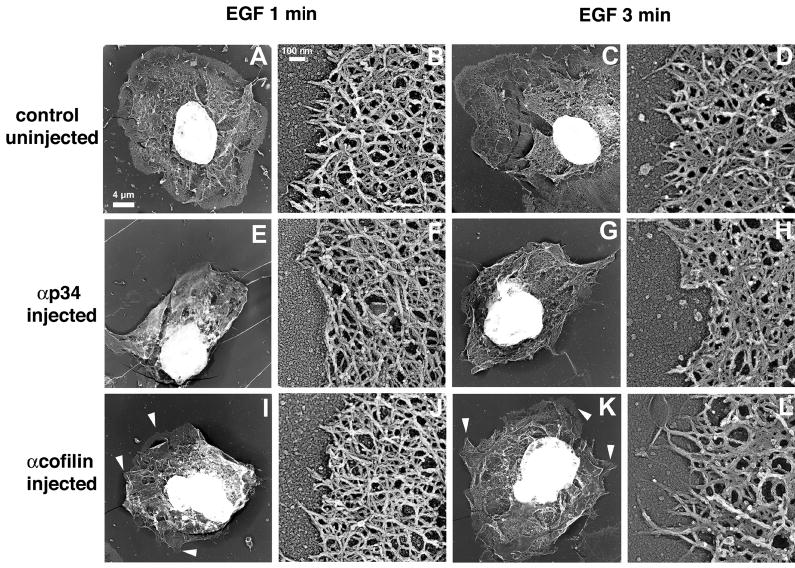
Blocking Arp2/3 function disrupts the actin network structure at the leading edge. Cells were microinjected with antibodies (E-H, anti-p34; I-L, anti-cofilin) or left untreated (A-D). After stimulation for 1 or 3 minutes with EGF, the samples were processed for replica electron microscopy. Low-magnification images are shown in A, C, E, G, I and K (Bar, 4 μm). High-magnification images (B,D,F,H,J,L) show typical leading edge areas or closest structure when leading edges were absent (Bar, 0.1 μm). Arrowheads indicate small protrusions, as opposed to broad lamellipods.