
FIG. 7.
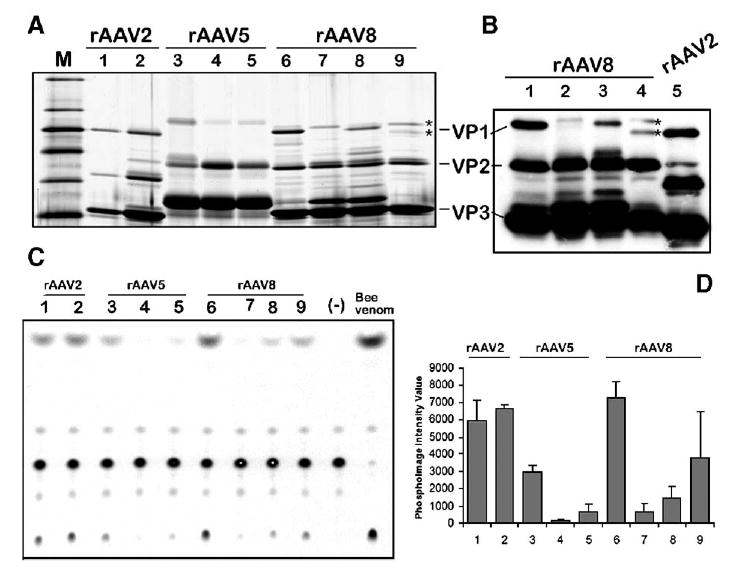
Analysis of the capsid protein VP1 content and the respective VP1up phospholipase A2 activity in rAAV vector stocks produced in 293 cells vs Sf9 cells. (A) Silver stain of polyacrylamide gel analysis (10% PAAG) of purified rAAV stocks prepared in HEK 293 and Sf9 cells. Lane 1, rAAV2-GFP/HEK 293; lane 2, rAAV2-GFP/Sf9; lane 3, rAAV5-GFP/HEK 293; lane 4, rAAV5-GFP/Sf9; lane 5, rAAV2/5-GFP/Sf9; lane 6, rAAV8-GFP/HEK 293; lane 7, rAAV8-GFP/Sf9; lane 8, rAAV2/8-GFP/Sf9; lane 9, mAAV8/2-GFP/Sf9. (B) Western blotting analysis (4–14% gradient PAAG) of rAAV8-GFP vector preparations (samples in lanes 1–4 are the same as in (A), lanes 6–9). For comparison purpose, baculovirus-produced rAAV2-GFP was analyzed next to mosaic mAAV8/2-GFP (compare the mobility of the respective VP1s marked by asterisks in lanes 4 and 5. (C)– Thin-layer chromatography of phospholipase A2 activity of virus produced in 293 cells vs Sf9 cells. The same amounts of rAAV particles (approximately 1010 drp) as in (A) were analyzed by the assay as described under Materials and Methods. Samples in lanes 1–9 correspond to the samples in lanes 1–9 in (A). Lane marked Bee venom contains positive control sample—1 ng of a bee venom phospholipase (Sigma). (D) Average values from two independent phospholipase assays quantified using phosphoimaging analysis. Samples are the same as in (A) and (C). The lower phospholipase activity of rAAV2/293 vs rAAV2/Sf9 reflects the inadvertently smaller amount of particles added to the electrophoresis well and the assay reaction (see A).