
Figure 4. Isobolograms demonstrate synergism of mitomycin-C and NV1066 for both KU19-19 (a) and SKUB (b) cell lines.
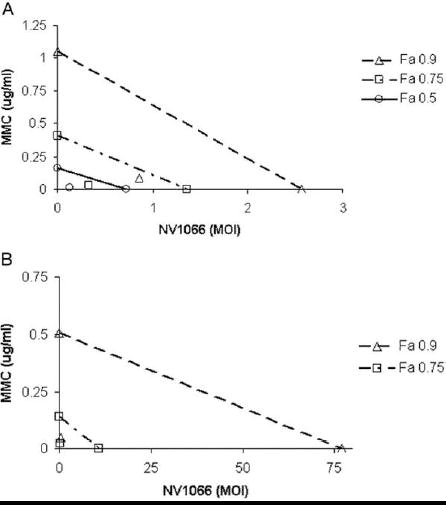
The doses of MMC (μGr/ml ) and NV1066 (multiplicity of infection- MOI) necessary to achieve 90% cell kill (open triangles) and 75% cell kill (open square) are plotted on the axes, and the connecting solid lines represent the expected additive effects for combination therapy. Experimental combination therapy doses necessary to generate actual LD values of 90% (open triangle FA=0.9), 75% (open squares FA=0.75) and 50% (open circle Fa=0.5) all lie to the lower left of the corresponding lines, indicating synergism. LD50 for SKUB cell line is not shown in the Figure B because of very low doses of each agent that can not be represented on the graph.