
Figure 3.
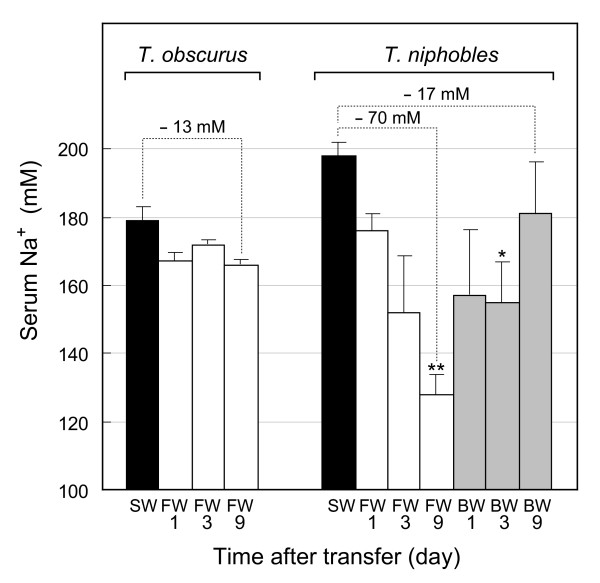
Changes in serum Na+ concentration during transfer from seawater (SW) to freshwater (FW) or to brackish water (BW). Results of T. obscurus and T. niphobles are shown on the left and right, respectively. Serum Na+ concentrations of the fish that adapted to SW, FW, and BW are shown as the black, white, and gray bars, respectively (n = 3–4). 14% SW was used as BW. *P < 0.01, **P < 0.001.