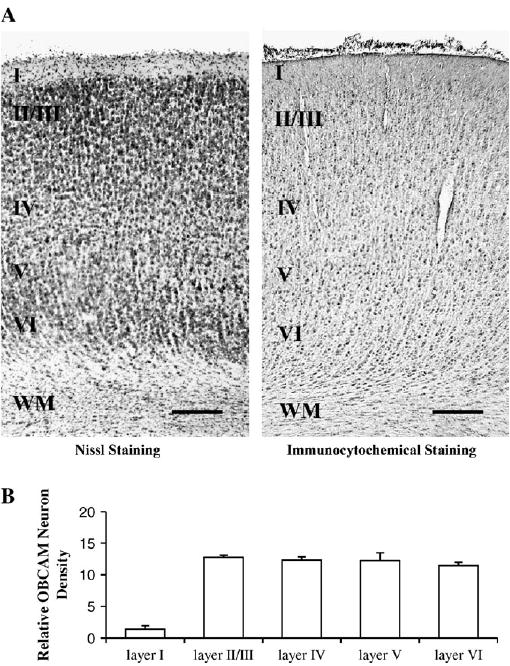
Figure 7.

(A) Photomicrographs illustrating the laminar distribution of OBCAM protein in 4-week-old kitten primary visual cortex. The letters I–VI indicate cortical layers; WM = white matter. Scale bar = 0.2 mm. (B) Histograms displaying the density of OBCAM neurons in the various cortical layers expressed as counts of the number of OBCAM-immunopositive neurons per 100 × 100 μm grid.
