
Fig 6.
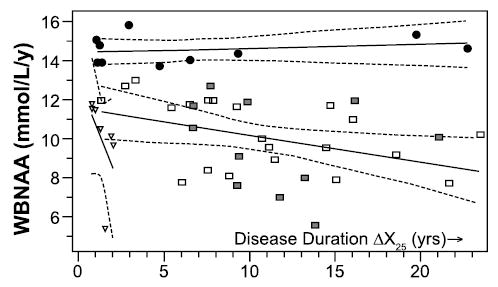
Whole-brain levels of N-acetylaspartate (WBNAA) for 49 patients with relapsing-remitting multiple sclerosis (MS) are plotted against each patient’s duration of MS, beginning with the initial clinical episode. The data define distinct trends for patients with an insignificant rate of NAA decline (black circles), a decline calculated not to exceed 1.7 mmol/L/y (squares, with shaded squares indicating patients who received MS treatment at the time of the NAA measurement), or a rapid decline (triangles). Dashed lines show 95% confidence intervals. Adapted with permission from Gonen et al. Relapsing-remitting multiple sclerosis and whole-brain N-acetylaspartate measurement: evidence for different clinical cohorts—initial observations. Radiology 2002;225:261–268.66