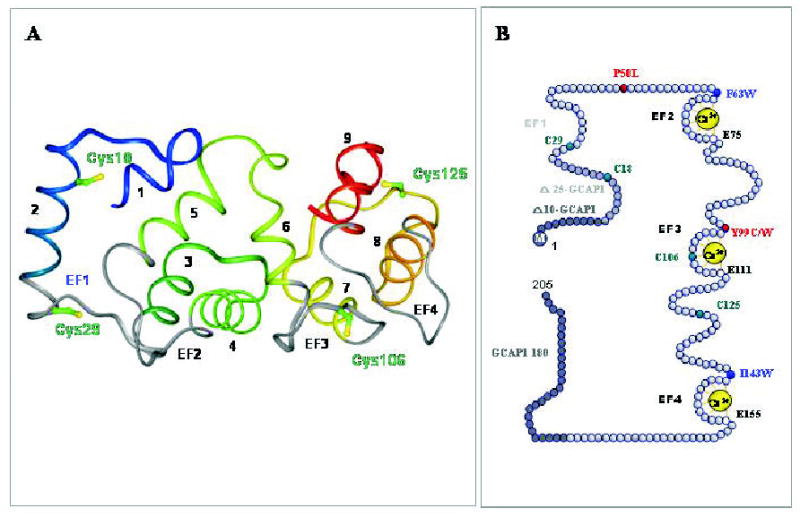
Figure 4. Structure of guanylate cyclase-activating protein 1.

A. A three dimensional model of GCAP1 based on the structure of GCAP2 (Ames et al., 1999). The helices are numbered and the EF-hand motifs are shown in gray. The central helix 6 is bridging two halves of GCAP to form a compact structure. Note that EF-hand 1 is nonfunctional and the model lacks the N-terminal myristoylation group not present in the original structure of GCAP2. Cys residues are marked in the GCAP1 three-dimensional model. This figure is reproduced from (Sokal et al., 2001) with permission from the American Society for Biochemistry and Molecular Biology. B. A model of the primary structure of GCAP1 and its mutants. Tyr and Pro residues mutated to Cys and Leu, respectively that are associated with autosomal dominant come dystrophy are shown in red. The native four Cys residues are represented in green, while hydrophobic residues, present in the front of Ca2+ binding loops, were used to identify conformational changes in GCAP1 (Sokal et al., 1999b), are shown in blue. M indicates myristoylation of GCAP1. Active GCAP1-180 is a deletion mutant lacking the C-terminal region. Further C-terminus truncation renders GCAP1 inactive. Active Δ10-GCAP1 and inactive Δ25-GCAP1 are deletion mutants lacking the N-terminal region, thus identifying the minimal essential region of GCAP1 necessary for the stimulation of ROS GC (Otto-Bruc et al., 1997). To disable the Ca2+ binding to EF2-, EF3- and EF4-hand motifs, Glu residues E75, E111 and E125 (residues marked by white circles) were changed to Asp (D). Inactivation of EF-2 maintained Ca2+-sensitivity of GCAP1, while inactivation of EF-hand 3 and EF-hand 4 led to constitutive activity (Rudnicka-Nawrot et al., 1998).
