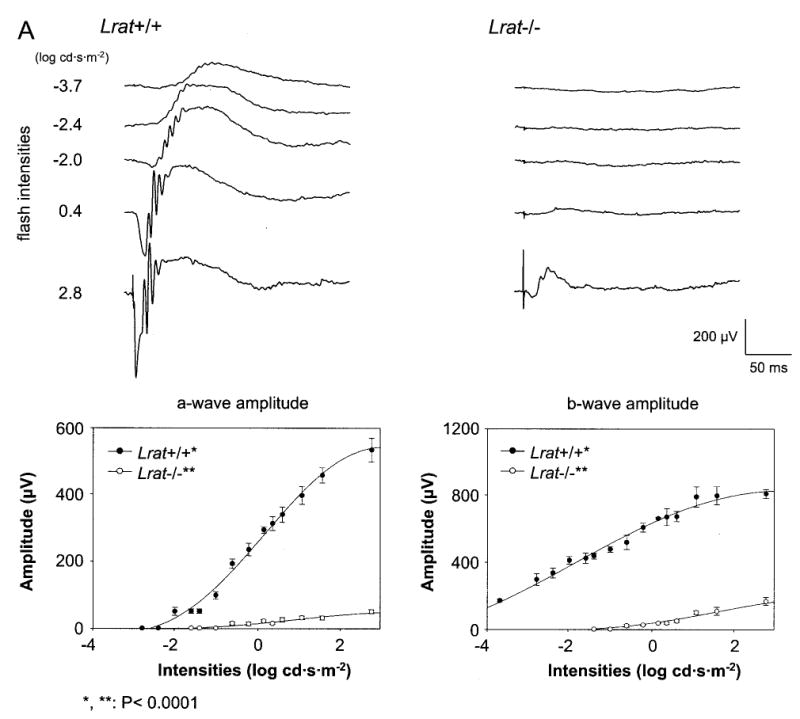
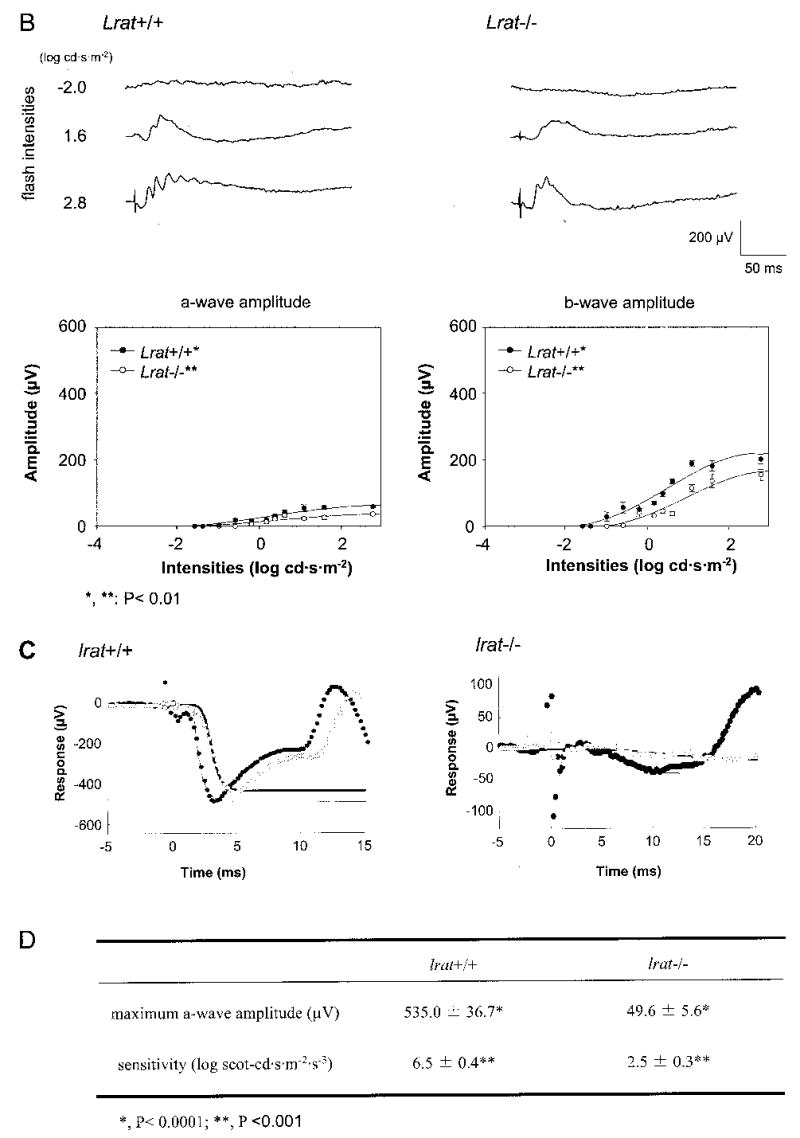
Fig. 6. Single flash ERG responses of increasing intensity for Lrat−/− and Lrat+/+ mice.


A and B, serial responses to increasing flash stimuli obtained from Lrat+/+ and Lrat−/− mice in dark-adapted (upper A panel) and light-adapted (upper B panel) conditions. Plotted ERG responses (a-wave and b-wave amplitudes) to increasing light stimuli in Lrat−/− show significantly lower responses compared with Lrat+/+ in both conditions (lower A panel, p < 0.0001; lower B panel, p < 0.01, one-way ANOVA). Light-adapted responses are examined after bleaching at 1.4 log cd·m−2 for 15 min. C, leading edges (initial 5–20 ms depending on response) of dark-adapted ERG photoresponses (symbols) evoked by 2.8-(filled circles) and 1.6-(open circles) log cd·s·m−2 flashes, are fit with a model of phototransduction (smooth lines). The amplitude and sensitivity of the Lrat−/− mouse photoresponses are reduced from maximal responses. D, maximum a-wave amplitude and sensitivity parameters of dark-adapted photoresponses in Lrat−/− mice compared with the results in Lrat+/+ mice. Lrat−/− mice show significant differences in both parameters (*, p < 0.0001; **, p < 0.001, one-way ANOVA) compared with Lrat+/+ mice. Error bars represent 1 S.E. in A and B.
