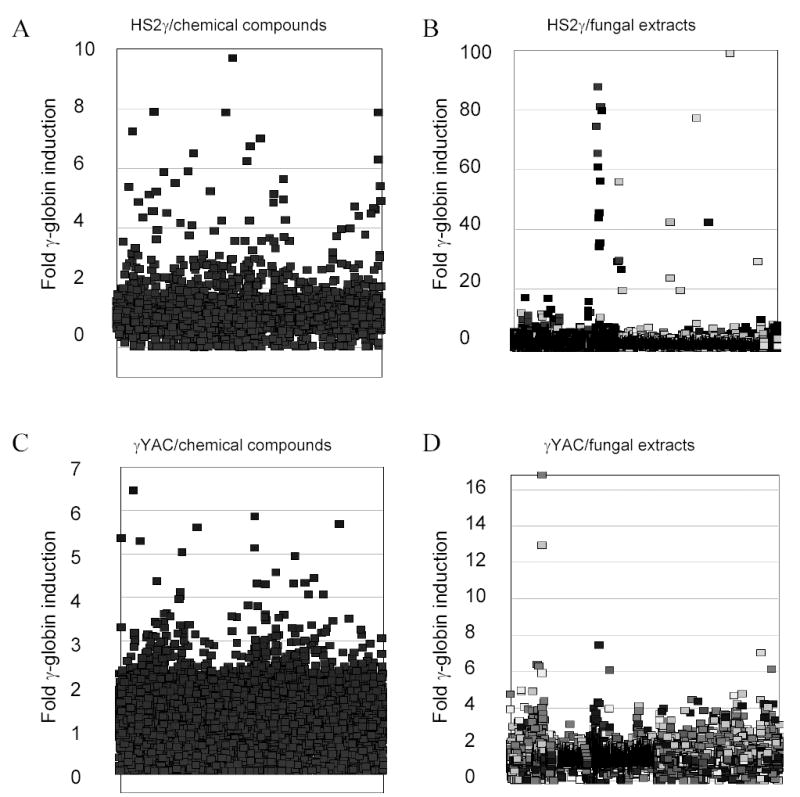
FIGURE 3.

Frequency distribution of fold transcription increases resulting incubation with chemical compound or fungal extracts. The y-axis records fold induction relative to vehicle control (0.2% DMSO). Compounds/extracts are distributed along the x-axis, which has no units. A) HS2γ cells exposed to compounds (scale 0 – 10); B) HS2γ cells exposed to fungal extracts (scale 0 – 100); C) γYAC cells exposed to compounds (scale 0 – 7); and D) γYAC cells exposed to fungal extracts (scale 0 – 17). Fold induction of 1 indicates no effect, while inductions <1 indicate cytotoxicity and/or repression. Clusters reflect related compounds in close proximity within the chemical and fungal extract libraries. Shading in panels B and D reflect different fungal growth conditions.
