FIGURE 4.

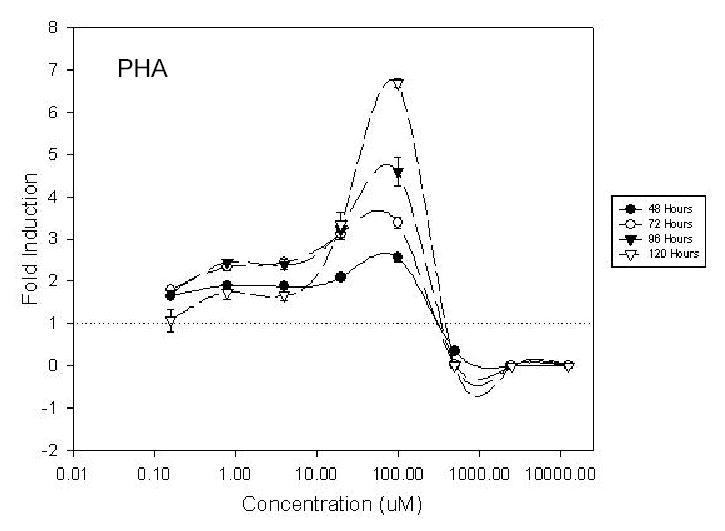
Dose response activity profile of K562/HS2γ cells exposed to proprionic hydroxamic acid (PHA) for 48, 72, 96 or 120 hours. Log concentration is indicated on the x-axis. Fold γ-globin transcriptional increase is shown on the y-axis.

Dose response activity profile of K562/HS2γ cells exposed to proprionic hydroxamic acid (PHA) for 48, 72, 96 or 120 hours. Log concentration is indicated on the x-axis. Fold γ-globin transcriptional increase is shown on the y-axis.