
Fig. 5.
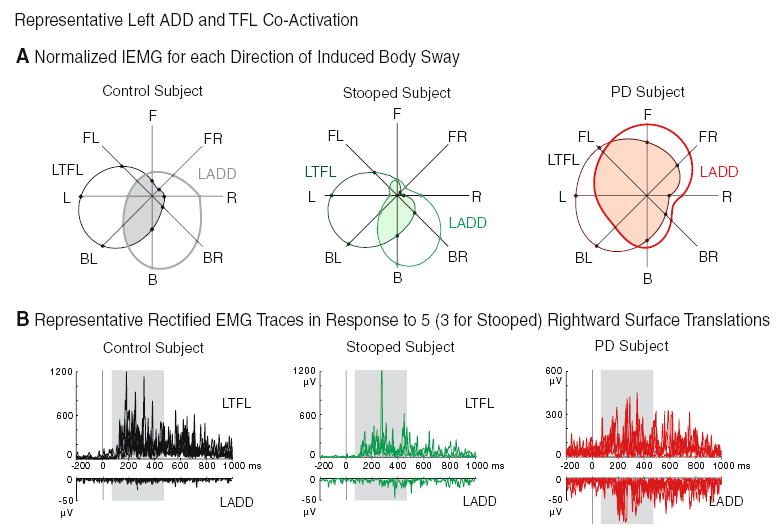
a Representative subject average IEMG values of the left ADD and TFL for each direction of induced body sway, demonstrating comparatively larger antagonistic co-activations (shaded regions) for the PD subject. Values represent a percentage normalized to the direction of maximum IEMG activation. b Representative subjects’ rectified EMG of the left TFL (top) and ADD (bottom) in response to five rightward translations (three for the stooped subject). The 400-ms period of integration (the shaded rectangle) began 70 ms after translation onset (solid bar at time zero)