
Fig. 3.
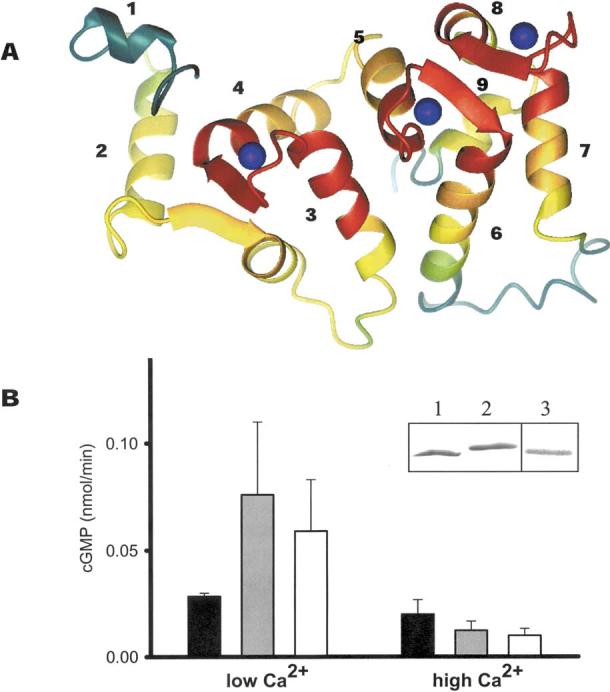
Structure and function of GCAPs. A Model of GCAPs based on the NMR structure of bovine GCAP2 (Ames et al. 1999). The conservation of residues between GCAPs was calculated using the T-Coffee method (Notredame et al. 2000). The polypeptide chain is colored as follows: red, 100-80%; orange, 80-60%; yellow, 60-40%; green, 40-20%; and green-blue, 20-0% similarity. Ca2+ions are shown as blue spheres. The most conserved regions are the Ca2+-binding sites (EF-hand loops). The GC-interacting site could involve helix 2 and the following β-sheet, helices 4, 5, and 7. B Reconstitution of ROS GC activity by recombinant bGCAP1 and zGCAP4. Blackbars correspond to ROS GC basal activity, gray bars correspond to ROS GC activity stimulated by bovine GCAP1, and white bars correspond to ROS GC activity stimulated by zGCAP4. Error bars represent standard deviations for GC activity stimulated by GCAPs. Assays were carried out at 50 nM and 1μM [Ca2+]free with the addition of 3 μM GCAPs and were repeated at least three times. Inset: SDS-PAGE (lanes 1 and lane 2) and immunoblotting (lane 3) of GCAP4. Lane 1 represents GCAP4 in the presence of 1 mM Ca2+; lane 2 represents GCAP4 in the presence of 1 mM EGTA.