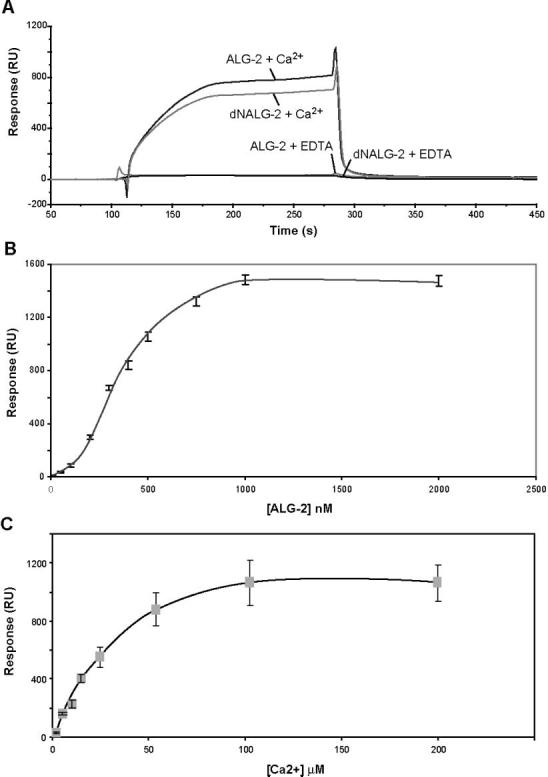
Figure 6.

Interaction of ALG-2 with Alix/AIP1. In panel A, Alix/AIP1 was immobilized to the sensor chip, and 400 nM ALG-2 or dNALG-2 in buffer containing either 50 μM CaCl2 or 20 μM EDTA was injected using the KINJECT program as outlined in the Materials and Methods. In panel B, different concentrations of ALG-2 (0–2 μM) in the presence of 50 μM CaCl2 were reacted with an Alix/AIP1 immobilized sensor chip. Average response values from duplicate runs at equilibrium plateau for each curve were plotted as a function of ALG-2 concentration. In panel C, samples containing 400 nM ALG-2 in the presence of varying amounts of CaCl2 (0–200 μM) were injected over the Alix/AIP1 immobilized sensor chip. Average response values from duplicate runs at equilibrium plateau for each curve were plotted as a function of Ca2+ concentration. Response for buffer salts and Ca2+ were subtracted using an unimmobilized control flow cell in all cases.
