
Figure 2.
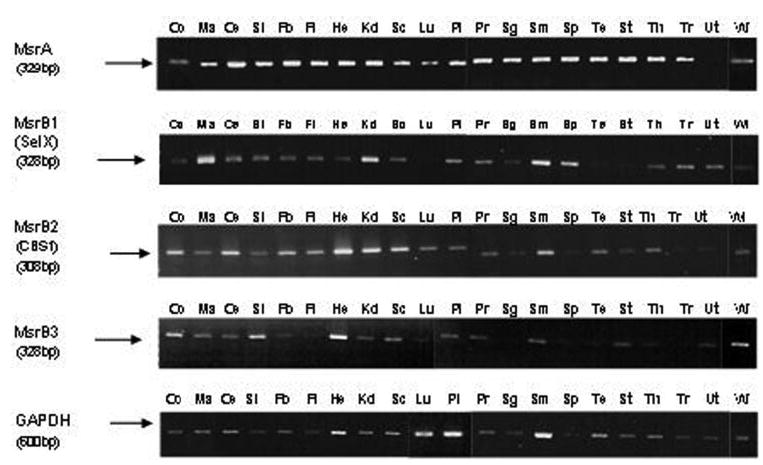
Tissue distribution of Msrs transcripts detected by semiquantitative RT-PCR. Ethidium-bromide–stained gels showing the relative levels of indicated Msrs and GAPDH transcripts in 21 different human tissues: Co, colon; Ma, bone marrow; Ce, cerebellum; Si, small intestine; Fb, fetal brain; Fl, fetal liver; He, heart; Kd, kidney; Sc, spinal cord; Lu, lung; Pl, placenta; Pr, prostate; Sg, salivary gland; Sm, skeletal muscle; Sp, spleen; Te, testis; St, stomach; Th, thyroid; Tr, trachea; Ut, uterus; Wl, whole lens.