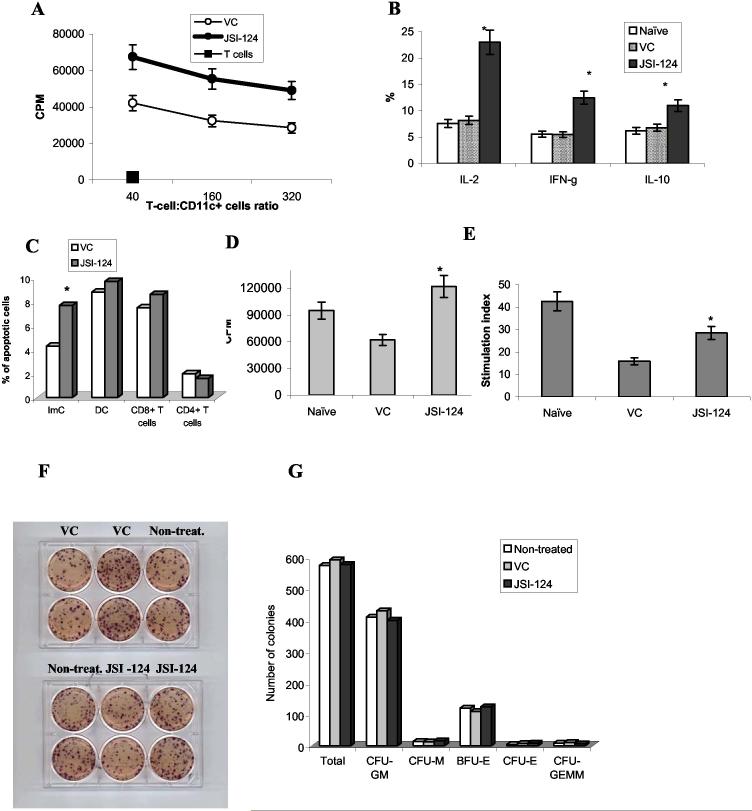
Figure 3.
In vivo effect of JSI-124 on DC function. (A, B) - CD11c+ DCs were isolated from lymph nodes (A) or spleens (B) of MethA sarcoma-bearing mice treated with either VC or JSI-124, irradiated and mixed together with T cells isolated from allogeneic C57BL/6 mice using T-cell enrichment columns (R&D Systems, Minneapolis, MN). (A) Cell proliferation was measured in triplicates after 4-day incubation using uptake of 3H-thymidine as described in Material and Methods. Two experiments with similar results were performed. (B) - after 48 hr incubation of T cells with DCs at 50:1 ratio, cells were fixed, permeabilized and stained with anti-IL-2, IFN-γ, and IL-10 antibody in combination with anti-CD4 antibody. The proportion of cytokine producing cells was evaluated within the population of CD4+ cells by flow cytometry. Each group included 3 mice. * - statistically significant differences between control (vc) and treated groups (p<0.05). (C) - MethA sarcoma-bearing mice were injected with DMSO (VC) or JSI-124 and 6 hr later splenocytes were collected and stained with Annexin V-PE/7-AAD and antibodies against different cell populations: CD11c-APC and IAd-FITC for DCs, Gr-1-APC and CD11b-FITC for ImC, CD4-FITC and CD8-APC for T cells. Apoptosis was measured within separate cell populations. Three mice formed each treated group. * - statistically significant differences between control (VC) and treated groups (p<0.05). (D, E) splenocytes were isolated from MethA sarcoma-bearing mice treated with DMSO or JSI-124. As a control splenocytes from naïve, tumor-free mice were also used in these experiments. 2×10⁵ splenocytes were stimulated for 4 days with either (D) 0.5 μg/ml anti-CD3 antibody or (E) 5 μg/ml ConA and proliferation was measured in triplicates using uptake of 3H-thymidine. Cumulative results of two performed experiments are shown. * - statistically significant differences between control (vc) and treated groups (p<0.05). In (E) stimulation index = cell proliferation in response to ConA / cell proliferation in non-stimulated cells. (F, G) - Bone marrow cells were collected from MethA sarcoma-bearing mice after 14 days of treatment with JSI-124 or DMSO (vehicle control, VC). In parallel, bone marrow cells were collected from non-treated MethA sarcoma-bearing mice. Colony-formation assay was performed in semi-solid media as described in Methods. 2×10⁴ bone marrow cells were plated per well. (F) - For the demonstration of overall number of colonies, cells were stained with MTT dye. Please note that only large colonies could be visible. (G) Unstained colonies were scored using inverted microscope. The numbers of colonies per 2×10⁴ bone marrow cells are shown. Experiment was performed in duplicates and included two mice per group. Colony-forming unites (CFU): GM - granulocyte/macrophage, M - macrophage, E - erythrocyte, GEMM - mixed. BFU-E - burst forming units erythroid.

