
Figure 3.
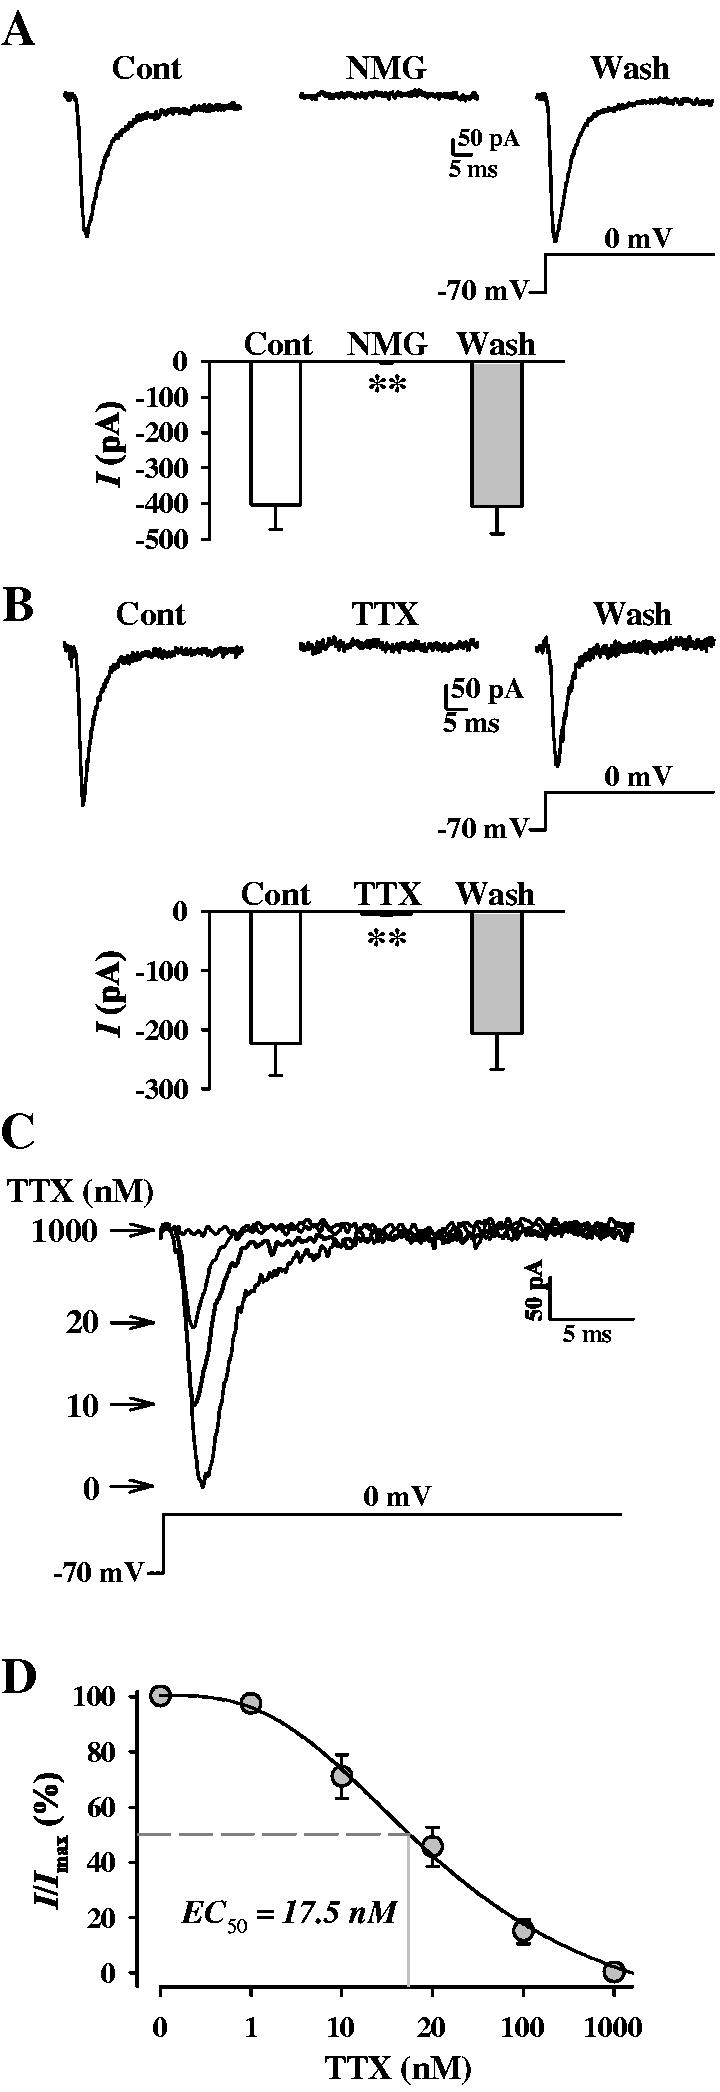
Pharmacological characterization of INa. A. Representative current traces (top), elicited by depolarizing a cell from a holding potential o f-70 mV to 0 mV, in PASMC before (Control), during (NMG), and after (Wash) replacement of extracellular Na+ with equimolar N-methyl-d-glucamine (NMG). Summarized (n = 4 experiments) current amplitude measured at 0 mV is presented in the histogram below. B. Representative currents (top), elicited by depolarizing a cell from a holding potential of -70 mV to 0 mV, in PASMC before (Control), during (TTX), and after (Wash) extracellular application of 1 μM TTX. The cells were superfused with Ca2+-free bath solution and dialyzed with K+-free and Cs+-containing pipette solution. Summarized (n = 4 experiments) current amplitude measured at 0 mV is presented in the histogram below. C. Representatives currents recorded at 0 mV in the absence (0) or presence of incremental (10, 20, 1000 nM) TTX. D. Concentration-response curve for TTX. Currents as represented in C were normalized and plotted as a function of [TTX]. I/Imax points were fit to determine EC50 (17.5 nM) (n = 3-5 cells for each concentration).