
Figure 7.
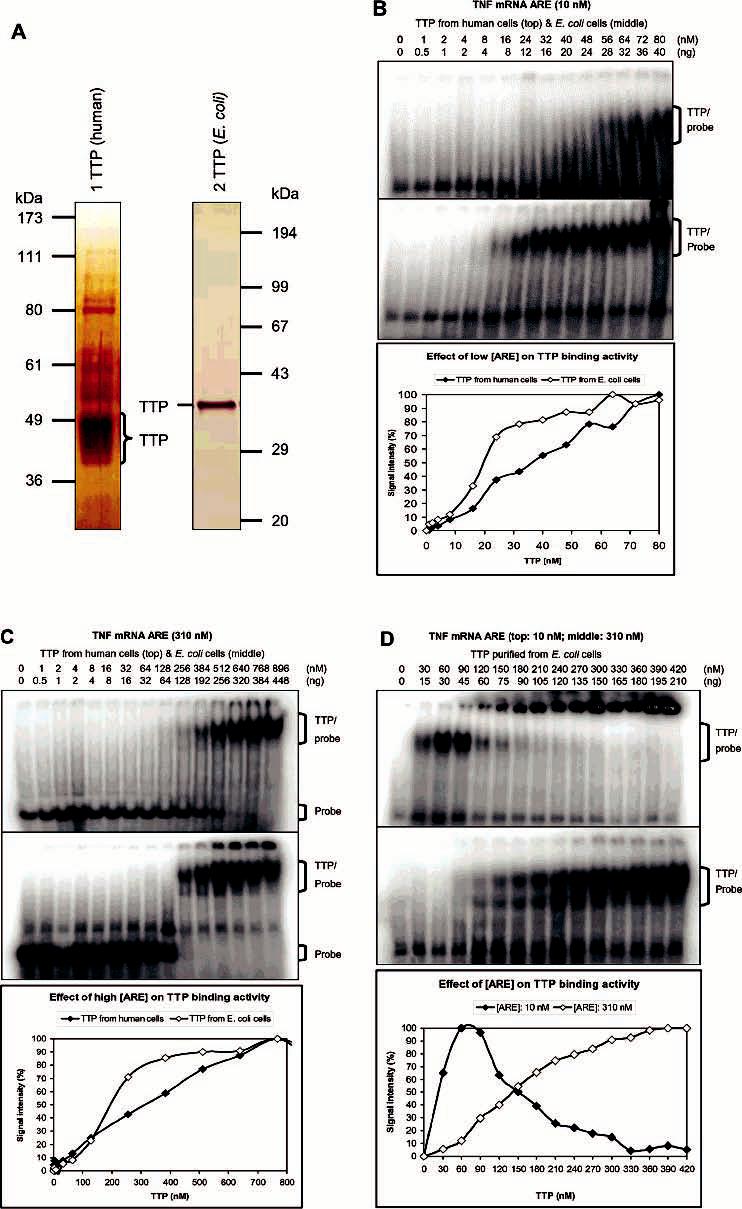
Binding kinetics of TTP for TNF mRNA ARE. Proteins were diluted with 100 mM imidazole buffer to 8.5 μL before being assayed for ARE binding activity in a 15 μL reaction mixture by GMSA. Gels were exposed to phosphorimager screens, and the signal intensity of the TTP–probe complexes and free probes was analyzed with ImageQuant 5.1. The results represented the means of two to four duplications. The positions of TTP–probe complexes and free probes are indicated. (A) Silver staining of TTP used for the binding kinetic studies. TTP was purified from transfected HEK293 cells and separated by 10% SDS–PAGE (lane 1) [72 ng/μL of a 70% pure sample, 50 ng (1.5 pmoL)−1 (μL of TTP)−1] or purified from overexpressed E. coli cells and separated by 12% SDS–PAGE (lane 2) [600 ng (18 pmoL)−1 μL−1, 100% purity]. (B) Effect of low ARE concentration (10 nM labeled ARE probe) on ARE binding kinetics: (top) TTP from HEK293 cells, (middle) TTP from E. coli cells, and (bottom) plot of the signal intensity of TTP-probe complexes vs the concentration of TTP. (C) Effect of high ARE concentration (10 nM labeled and 300 nM unlabeled ARE probe) on ARE binding kinetics: (top) TTP from HEK293 cells, (middle) TTP from E. coli cells, and (bottom) plot of the signal intensity of TTP–probe complexes vs the concentration of TTP. (D) Effect of ARE concentrations on the binding kinetics of TTP from E. coli cells: (top) 10 nM labeled ARE probe, (middle) 10 nM labeled and 300 nM unlabeled ARE probe, and (bottom) plot of the signal intensity of TTP–probe complexes vs the concentration of TTP.