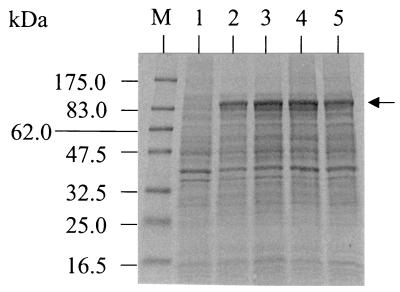
FIG. 6.
SDS-PAGE of cell extracts showing the expression of the P450RhF gene in E. coli. Coomassie-stained 10 to 20% gradient polyacrylamide gel of whole-cell extracts. Two expression clones, both E. coli BL21(DE3)pAG03, were analyzed following growth at 30°C in the absence of IPTG (lanes 2 and 4). There was no significant difference in the banding profiles following induction with IPTG (lanes 3 and 5, respectively). Lane 1 shows the results for the negative control, E. coli BL21(DE3)pET3a, following incubation with IPTG. The arrow indicates the position of the recombinant protein. Molecular mass markers are shown in lane M.

