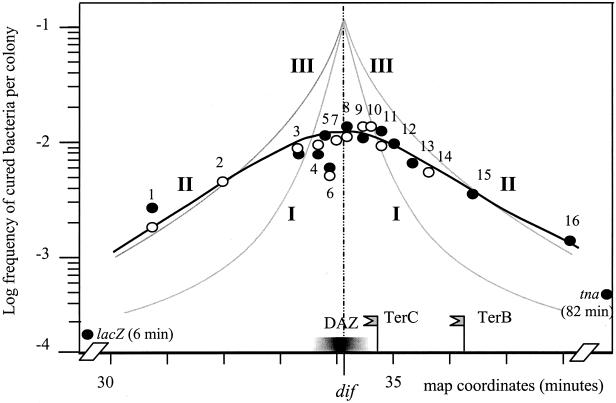
FIG. 4.
Frequency of prophage loss from various positions in the TER region of the ftsK1::cat mutant. The frequency of cured bacteria is plotted against the position of the tetAR integration locus. Symbols: •, prophages in antiorientation; ○, prophages in iso-orientation. Curve II, based on the present data obtained in the ftsK1 mutant, takes into account both orientations. The other curves are extracted from previously published work (12): curve I, xerC2 mutant, prophage iso-oriented; curve III, xerC2 mutant, prophage antioriented. The positions of relevant loci (dif, TerC, TerB) are indicated. The extent of the DAZ, the zone in which dif gains progressively resolution activity as it is moved toward its natural site (29), is shown by a graded bar. The positions tested (the distances in kilobases from dif are in parentheses, negative to the left and positive to the right): 1, zda192 (−151); 2, trg (−100); 3, zdc310 (−35.3); 4, zdc330 (−15.8); 5, Δ(zdc330-zdc338) (−15.8/−7.0); 6, zdc338 (−7.0); 7, Δ(zdc338-hipA) (−7.0/+1); 8, hipA (+1); 9, zdd355 (+8.9); 10, zdd365 (+17.8); 11, zdd370 (+23.2); 12, zde381 (+34); 13, zde395 (+48); 14, zde406 (+58); 15, zdf237 (+100); and 16, zdh57 (+180). Both prophage orientations were assayed at positions 1, 3, 4, 6, 8, 9, and 11. Curing frequencies of prophages inserted at positions external to the terminus, lacZ (6 min), and tna (82 min) are also indicated. They were as low in the FtsK− background, 1.5 × 10⁻⁴ and 3.5 × 10⁻⁴, respectively, as in wild-type bacteria at the same positions (25).

