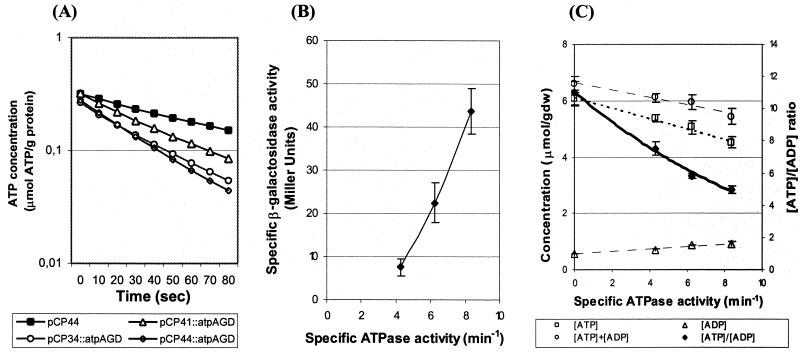
FIG. 2.
Introduction of ATPase activity by overexpression of F1 genes. (A) Direct measurements of ATPase activities in E. coli LM3115 derivatives. The change in ATP concentration related to the total protein level is shown as a function of time after the addition of cellular extracts. The plasmid contents in strains BK1169(pCP44), BK1171(pCP34::atpAGD), BK1172(pCP41::atpAGD), and BK1173(pCP44::atpAGD), respectively, are indicated in the box. (B) Correlation between specific ATPase activity and specific β-galactosidase activity. (C) Correlation between specific ATPase activity with ATP, ADP, ATP+ADP pools and [ATP]/[ADP] ratios. The experimental data for the ATP, ADP, and ATP+ADP pools are fitted to linear curves shown by dotted lines, and the [ATP]/[ADP] ratio is fitted by a curve shown by a full line. Error bars indicate the standard deviations of the measurements. The data represent the average of four to six measurements.

