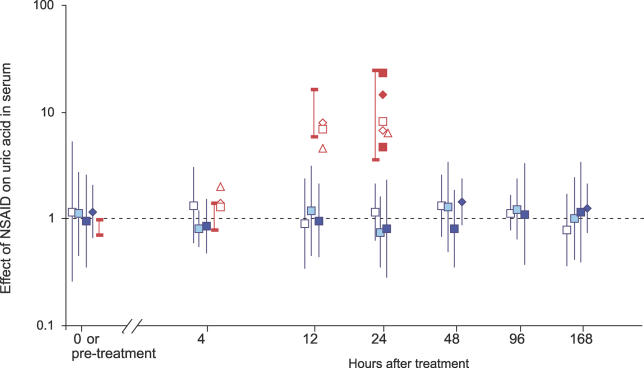
Figure 1. Effect of Administration of Meloxicam and Diclofenac by Gavage on Uric Acid in the Serum of Vultures.
Blue symbols show the ratio of the geometric mean serum concentration of uric acid for a group ofGyps africanus treated with meloxicam by gavage to that for a control group treated with water and sampled at the same time. Vertical lines show 95% confidence limits for the ratio. The dashed horizontal line indicates a ratio of 1; i.e., no effect of treatment. For each of six samplings after treatment, results are shown for experiments in which different doses of drug were used. The fill colour of the blue symbols indicates the meloxicam dose for the treated group: white = 0.5 mg kg−1 (Phase I); light blue = 1.0 mg kg−1 (Phase II); dark blue = 2.0 mg kg−1 (squares = Phase III, diamonds = Phase IV-2). Red vertical bars show the maximum and minimum values of the equivalent ratio for two groups ofG. africanus, one group treated with 0.8 mg kg−1 of diclofenac by gavage and another group treated with water and sampled at the same time. Open red symbols show the ratio of the serum concentration after treatment to that at the time of treatment for three individualG. fulvus given 0.8 mg kg−1 of diclofenac by gavage. Filled red symbols show the ratio of the serum concentration 24 h post-treatment to that 1 h post-treatment for three individualG. bengalensis given 0.25 mg kg−1 (squares) and 2.5 mg kg−1 (diamond) of diclofenac by gavage. Data from diclofenac experiments were taken from references [1] and [7].

