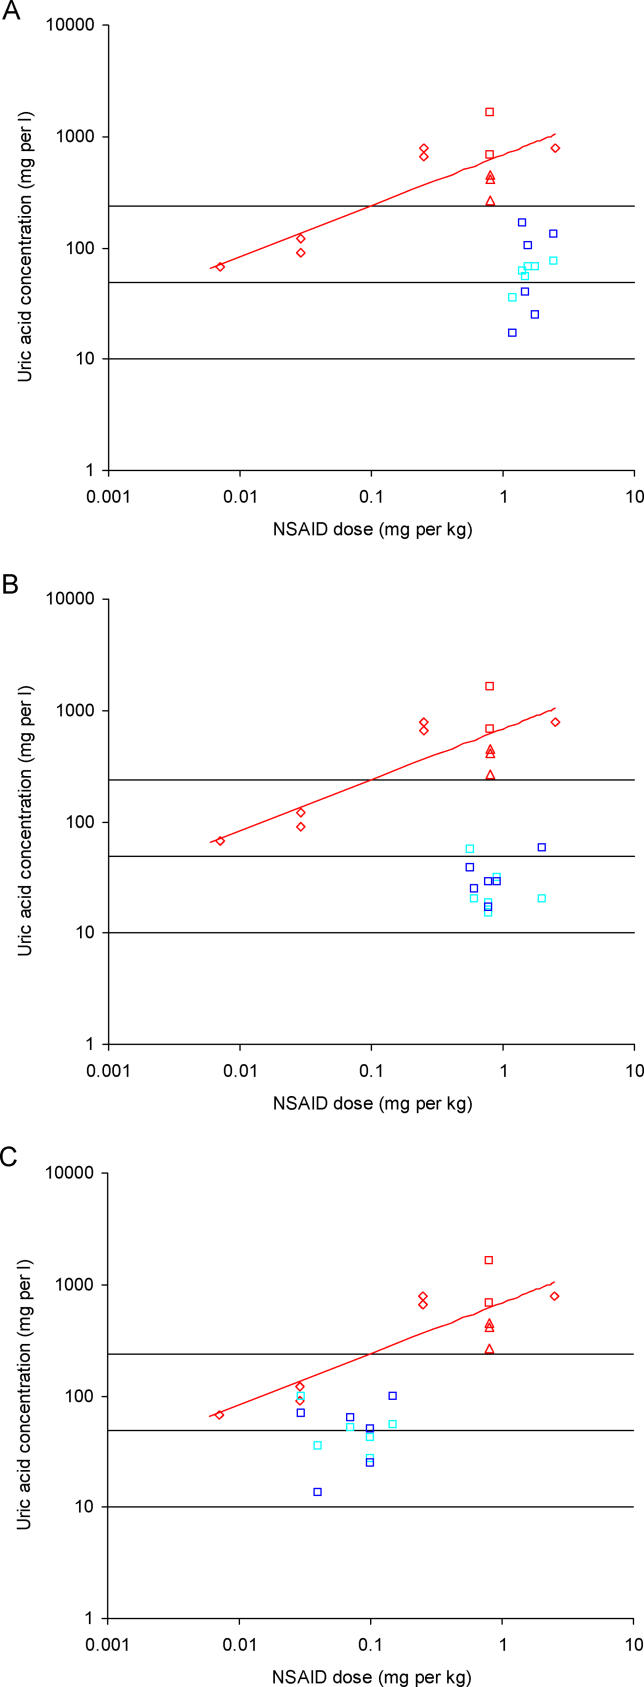
Figure 2. Relationship of Uric Acid in Serum to the Dose of Meloxicam and Diclofenac Administered and to the Administration Method.
Serum concentration of uric acid inGyps africanus 48 h (turquoise) and 96 h (blue) after treatment, in relation to the dose of meloxicam administered per kg of vulture body weight. For comparison, the geometric mean uric acid level (central horizontal line) and 95% range (upper and lower horizontal lines) of the experimental birds 24 h before treatment are shown. Also shown are serum concentrations of uric acid 24 h after treatment inG. africanus (red squares),G. bengalensis (red diamonds), andG. fulvus (red triangles), to which diclofenac was administered by various methods. The red line shows the regression model fitted to these data. Panels show results for different methods of administration of meloxicam toG. africanus: (A) gavage, (B) by feeding liver from meloxicam treated cattle, (C) by feeding muscle from meloxicam-treated cattle. Data from diclofenac experiments were taken from references [1] and [7].

