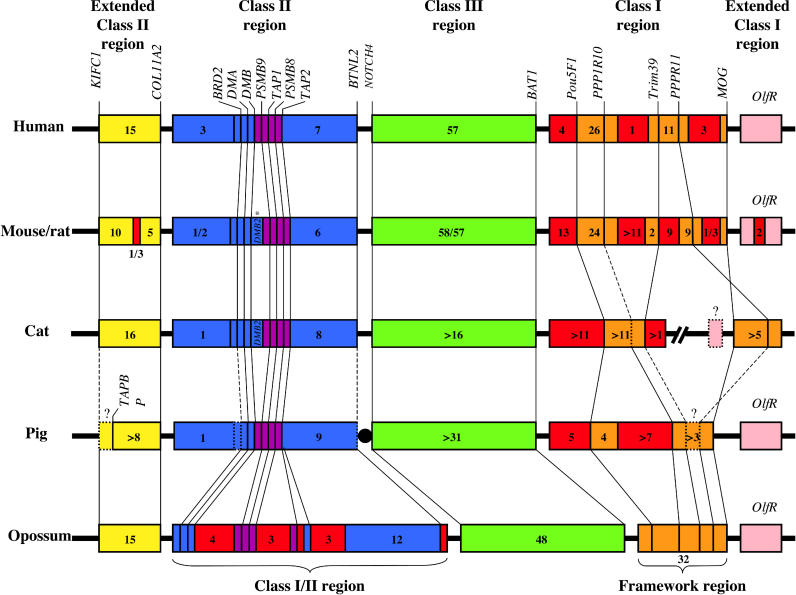
Figure 3. Comparative Map of the MHC Organization in Mammals.
The color code is the same as inFigure 1. Orthologous genes are indicated by connecting lines. Dashed lines and question marks represent unknown or uncertain data for a given gene or portion of the genome. The total number of genes is reported for each region or sub-region (pseudogenes are not included). Map is not drawn to scale. Unless specified, the small boxes represent single genes. This map was generated using data from [2,47]. The asterisk in the figure indicates that the duplication of DMB concerns only the mouse.

