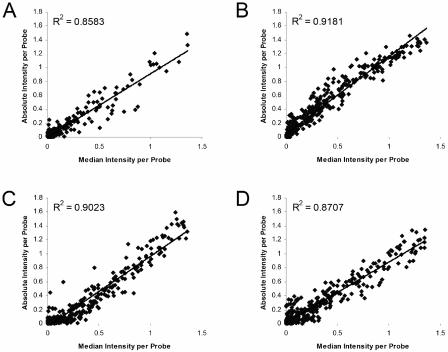
FIG. 2.
Fingerprinting array method level reproducibility. Scatter plots for hybridization (A) and method level (B-D) reproducibility. Panel A shows results for a randomly selected Mix-10 array relative to the median intensity for 66 probes (52 replicate arrays), reflecting the behavior and reproducibility of the microarray itself during hybridization. The R2 value is for the single array and regression line shown in the panel. Average R2 values are in Table 4. Panels B-D show results for B. thuringiensis 97-27, B. anthracis A0392, and Campylobacter jejuni 11168 (12 replicate arrays), respectively, which are inclusive of PCR amplification and labeling steps. Results were similar for all other isolates, as shown in Table 4.

