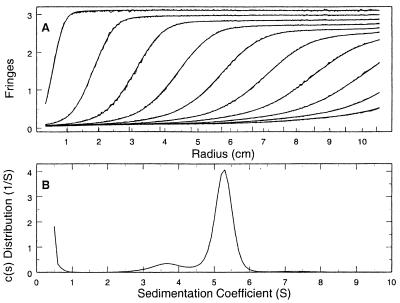
FIG. 3.
Sedimentation velocity ultracentrifugation of E. faecalis HMG-CoA synthase. (A) Sedimentation boundaries measured by using Rayleigh interference optics plotted against radial position. The data shown are for 25-min intervals and represent one-fifth of the data used in the analysis. The jagged lines represent the observed fringes, and the smooth lines represent the calculated best-fit distribution calculated by using Sedfit 8.3 and the Lamm equation model (23). (B) Best-fit c(s) sedimentation coefficient distribution, allowing for systematic time-invariant noise. The uncorrected values for the sedimentation coefficients for the minor and major peaks are 3.6 and 5.3 S, respectively.

