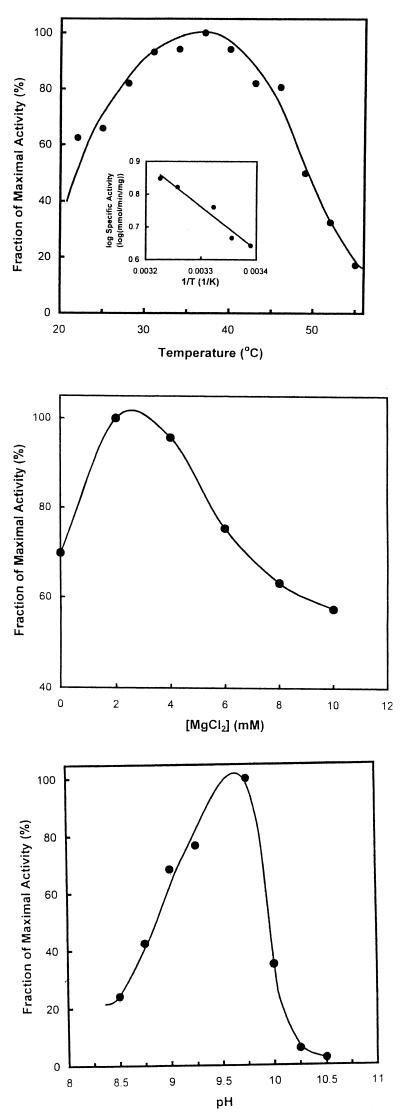
FIG. 4.
Effect of temperature, MgCl2 concentration, and hydrogen ion concentration. (Top) Temperature. Assays were conducted at the indicated temperatures under otherwise standard conditions. The inset shows selected data shown as an Arrhenius plot. (Middle) MgCl2.Assays were conducted at the indicated concentrations of MgCl2 under otherwise standard conditions. (Bottom) Hydrogen ion concentration. Assays were conducted in 50 mM sodium acetate, 50 mM glycine, 50 mM Tris, and 50 mM 2-(N-morpholino)ethanesulfonic acid at the indicated pH under otherwise standard conditions.

