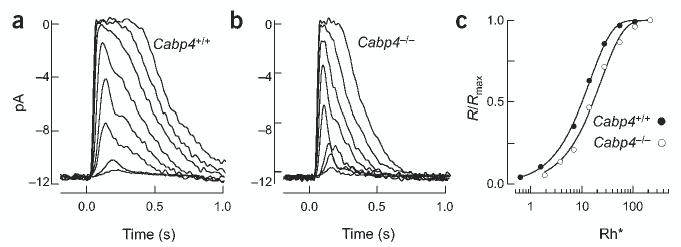
Figure 4.

Current responses of Cabp4+/+ and Cabp4−/− rod outer segments. (a) Flash family measured from a Cabp4+/+ rod. Average responses (5–100 trials at each flash strength) are superimposed for flashes producing 0.65, 1.3, 7, 14, 28, 56, 112 and 224 Rh*. (b) Flash family measured from a Cabp4−/− rod as in a. Flash strengths are 1.9, 3.8, 7.6, 14, 26, 56, 112 and 224 Rh*. (c) Stimulus-response relationship for the Cabp4+/+ (•) and Cabp4−/− (○) rod in a and b. Response amplitudes were normalized to the maximal response and were plotted against flash strength. Saturating exponential fits to the data were used to estimate the half-saturating flash strength.
