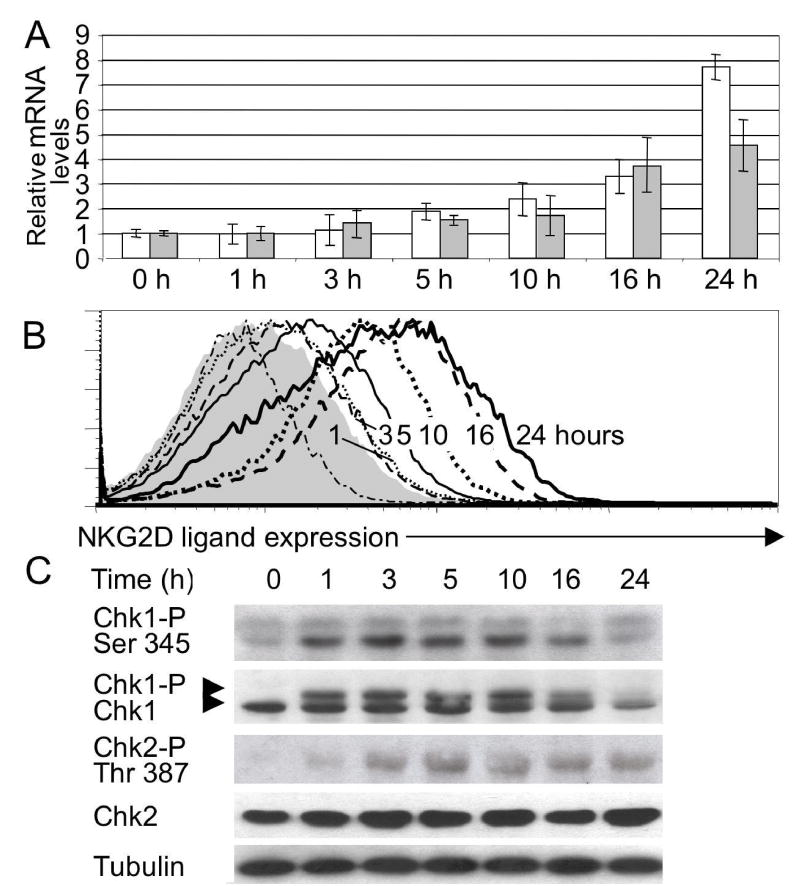
Figure 3. Kinetics of upregulation of NKG2D ligands and phosphorylation of the Chk1 kinase.
A) Levels of Rae1 (open bar) and MULT1 (filled bar) transcripts determined by real-time RT-PCR in cultured fibroblasts treated with aphidicolin for the indicated times. The Rae1 primers amplify all Rae1 isoforms. Data represent means ± SD, n = 3 independent experiments. B) Cell surface expression of NKG2D ligands on cells from panel A. C) Kinetics of phosphorylation of Chk1 in aphidicolin-treated fibroblasts. Phosphorylation was detected by Western blotting as a shift in the mobility of Chk1, or with the use of a phospho-Ser345 Chk1 or phospho-Thr387 Chk2 specific antibody.

