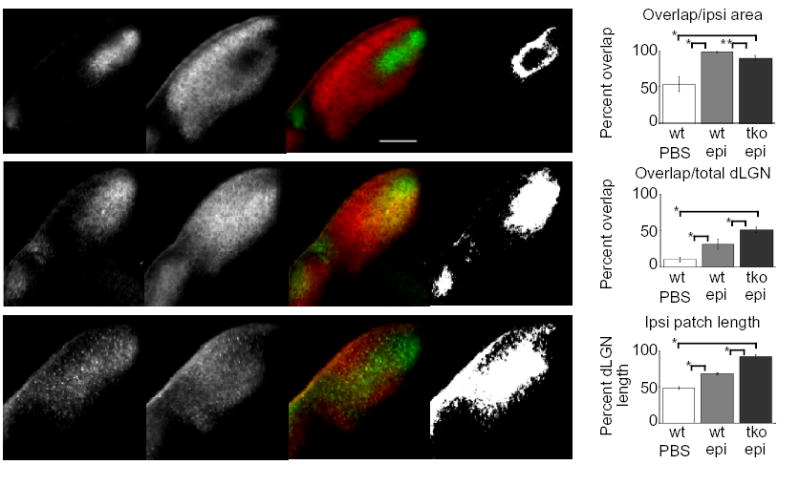
Fig. 4.

Area of dLGN overlap is increased in epibatidine-treated ephrin-A2/A3/A5 mutant mice as compared to epibatidine-treated wild-type mice. (a–c) Photomicrographs of 150μm thick coronal dLGN sections from P9 wild-type (a, b) and ephrin-A2/A3/A5 mutant mice (c) that received binocular intravitreal epibatidine injections (b, c) or PBS control injections (a) every 24 hours from P3 to P7. The pictures are shown in groups of four representing, from left to right: the ipsilateral projection, the contralateral projection, the merged image and a binary image representing dLGN area with overlapping ipsilateral and contralateral projections. Dorsal is to the top, medial is to the right. The scale bar is 200μm. (d) Quantitative comparison of ipsilateral and contralateral axonal overlap between control (wt PBS), wild-type (wt epi), and ephrin-A2−/−A3−/−A5−/− or ephrin-A2−/−A3+/−A5−/− (tko epi) mutant mice, presented as the percentage of the ipsilateral area containing overlapping contralateral projections. (e) Quantitative comparison of ipsilateral and contralateral axonal overlap between control, wild-type and ephrin-A2−/−A3−/−A5−/− plus ephrin-A2−/−A3+/−A5−/− mutant mice, presented as the percentage of the total dLGN area containing overlap. (f) Quantitative comparison of the ipsilateral patch length between control, wild-type, and ephrin-A2−/−A3−/−A5−/− (or ephrin-A2−/−A3+/−A5−/−) mutant mice, expressed as the percentage of the dLGN length covered by the ipsilateral patch along the DM-VL axis. (* P << 0.001; ** P < 0.005, ANOVA test) (wt+PBS, wt+Epi: n=4 mice (16 dLGN sections); ephrin-A2−/−A3−/−A5−/− plus ephrin-A2−/−A3+/−A5−/−+Epi: n=4 mice (2 of each genotype, 16 dLGN sections).
