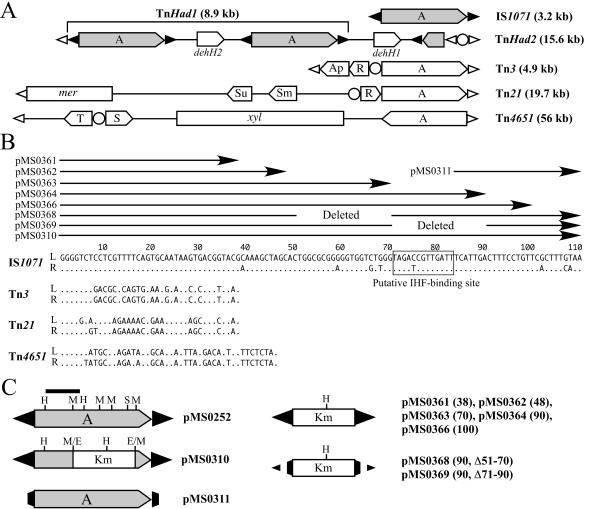
FIG. 1.
Structures of class II transposons, their IR sequences, and IS1071 derivatives. (A) Schematic structures of the class II transposons. The sizes are arbitrary. The black and white arrowheads indicate the terminal IR sequences of IS1071 and those of the representative transposons, respectively, and the circle represents the res site. The pentagon shows the orientation of the gene. Abbreviations: A, tnpA gene; R, S, and T, genes for cointegrate resolution; Ap, Sm, Su, and mer, genes for resistance to ampicillin, streptomycin, sulfonamide, and mercury, respectively; xyl, genes for degradation of toluene and xylenes. (B) Comparison of IR sequences. The left (L) and right (R) ends of IS1071 are defined as those located upstream and downstream, respectively, of the tnpA gene, and those of other transposons are defined as the distal and proximal ends, respectively, to the tnpA gene. A dot indicates a nucleotide identical to that in the left IR of IS1071. The arrows indicate the IR sequences that are carried in the IS1071 derivatives on the plasmids depicted. The boxed sequence represents the putative IHF-binding site. (C) Structures of the IS1071 derivatives on the pMS plasmids. The black bar indicates the DNA fragment used as a probe for the Southern analysis (Fig. 3). E, H, M, and S represent EcoRI, HindIII, MunI, and SalI sites, respectively. The values in parentheses are the lengths of the mutant IRs in the pMS plasmids.

