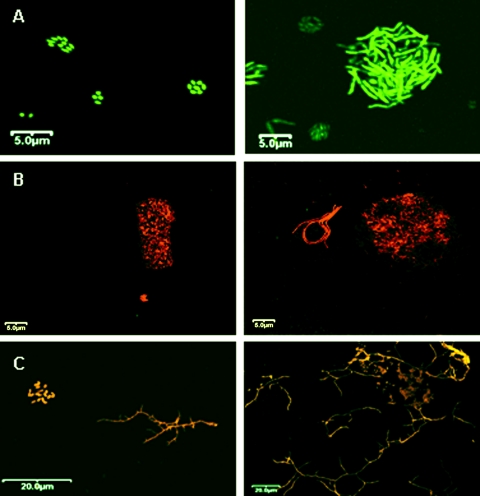
FIG. 3.
Confocal images of standard and enriched membranes from three soil samples following hybridization (red-orange) and total bacterial staining (green) at a magnification of ×600. The left panels refer to standard membranes, and the right panels represent enriched membranes. MQA (A) soil was stained with only SYBR green. MQB (B) soil and RH (C) soil were dual; stained with CARD-FISH (red) and SYBR green. Marked differences in microcolony morphology following rRNA enrichment were observed.

