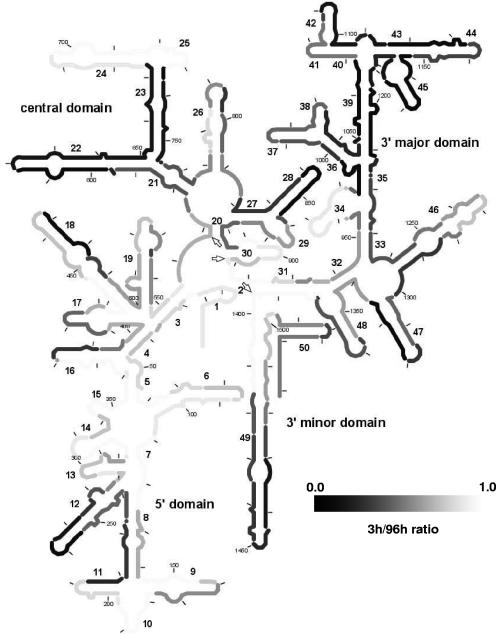
FIG. 7.
Putative kinetic accessibility map of 16S rRNA of E. coli based on the ratio of brightness with 3-h hybridizations to brightness with 96-h hybridizations. Light areas represent high 3-h/96-h ratios, while dark areas represent low 3-h/96-h ratios. Only the data from probes yielding brightness values of >40 CBU for 96-h hybridizations were used. Residues targeted by multiple probes were assigned the average 3-h/96-h ratio for all the probes. The arrows indicate the bordering nucleotides between adjacent domains (i.e., positions 566, 912, and 1396).

