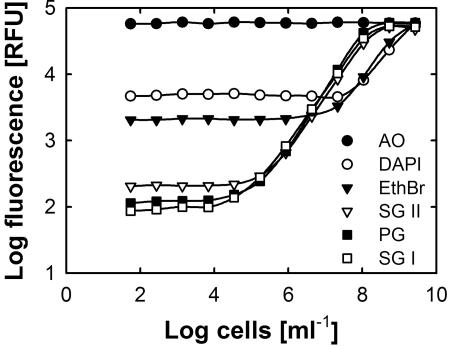
FIG. 1.
Comparison of six nucleic acid dyes for the detection of bacterial cells in a microplate assay. Each data point represents the mean of four (PicoGreen) or eight replicates. Standard deviations were omitted for clarity. AO, acridine orange; EthBr, ethidium bromide; PG, PicoGreen; SG II, SYBR green II; SG I, SYBR green I.

