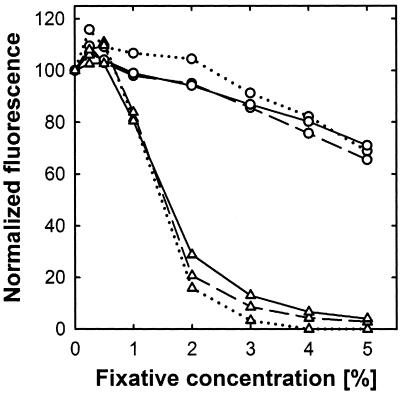
FIG. 5.
Effects of different glutaric dialdehyde (circles) and formaldehyde (triangles) concentrations on fluorescence emission of SYBR green I-stained DNA. Different DNA concentrations (dotted lines, 10 ng ml−1; dashed lines, 100 ng ml−1; solid lines, 1,000 ng ml−1) were incubated with fixative for 1 hour prior to staining. The resulting fluorescence was recorded and is displayed as a relative decrease compared to that of pure DNA (defined as 100%). Each data point represents the mean of three replicates. Standard deviations were negligible and were omitted for clarity.

