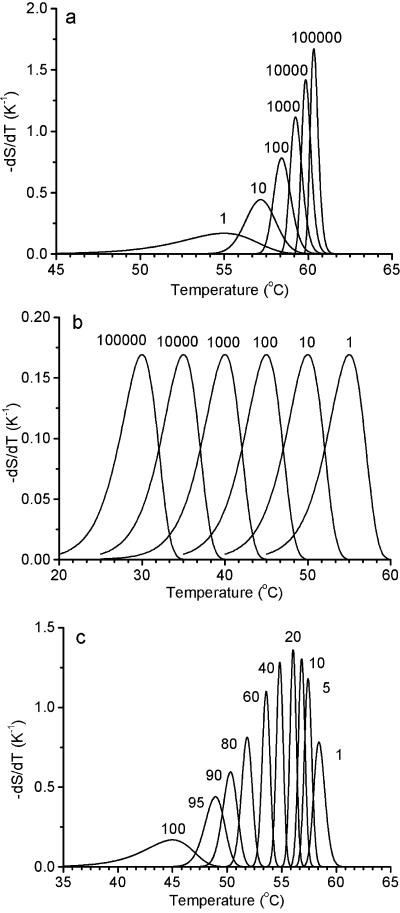
FIG. 3.
Calculations for the rate of decline of surviving cells during temperature scanning based on differentiating equation A3. (a) Plot assuming that all copies of a critical component must be critically damaged for a cell to die (R = 1). The numbers indicate the number of copies per cell (n). The line for n = 1 also represents the rate of critical damage of the critical component, dx/dT. (b) Plot assuming that no copies of a critical component must be damaged for the cell to survive (R = n). The numbers indicate the number of copies per cell (n). (c) Plot assuming that the total number (n) of copies of the critical component per cell is 100. The number (R) of copies that are not critically damaged per cell is indicated beside each line. The fraction of critical components that are critically damaged is x = 1 − exp[−exp(0.4606T − 25.333)], representing a process with a D value of 0.5 min at 55°C and a z value of 5°C for scanning at a rate of 10°C/min (9).

