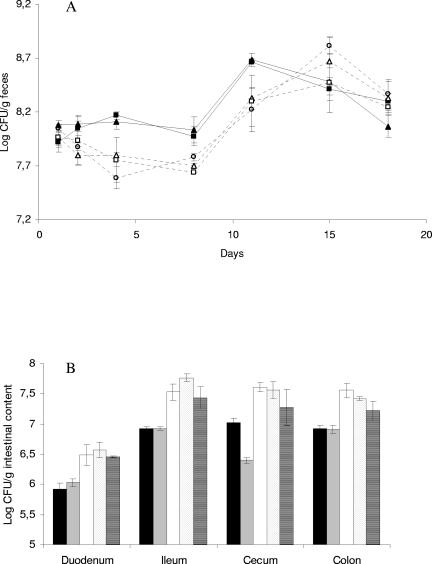
FIG. 1.
(A) Bifidobacterial populations in feces of rats dosed with nisin-producing L. lactis (closed triangles), non-nisin-producing L. lactis (closed squares), 60 mg nisin (open trangles), 0.6 mg nisin (open squares), and PBS (open circles). Each point represents the mean of data from animals in one dose group. Error bars designate standard errors of the means. Animals were dosed on day 1 and day 2. Statistical analysis confirmed that, between day 2 and day 11, numbers of bifidobacteria in the feces of animals inoculated with either of the L. lactis strains (closed symbols) were higher than in the other three groups (open symbols). (B) Densities of enterococci/streptococci in intestinal samples from rats 25 days after dosage with nisin-producing L. lactis (black), non-nisin-producing L. lactis (gray), 60 mg nisin (white), 0.6 mg nisin (dots), and PBS (stripes). Each point represents the mean of data from animals in one dose group. Error bars designate standard errors of the means. Statistical analysis confirmed that the densities of enterococci/streptococci in all sections of the gut were lower in animals dosed with either of the L. lactis strains (black and gray shaded bars) than in the other three groups.

