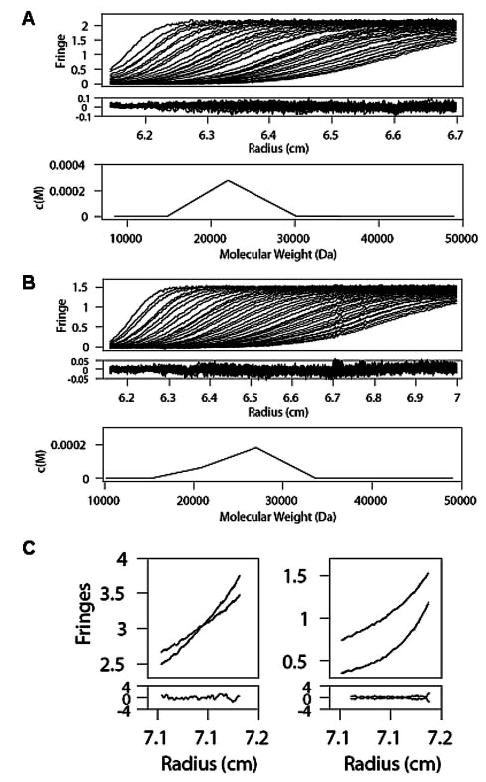
FIGURE 4. Analytical ultracentrifugation data of p75NTR, NGF, and p75NTR·NGF complex.

p75NTR (A) and NGF (B) sedimentation velocity measurements. Collected data (top), fringes (middle), and continuous c(M) distribution (bottom) (C) p75NTR·NGF complex sedimentation equilibrium measurement at 0.25 mg/ml (left panel) and 0.5 mg/ml (right panel). Both concentrations were run at two speeds.
