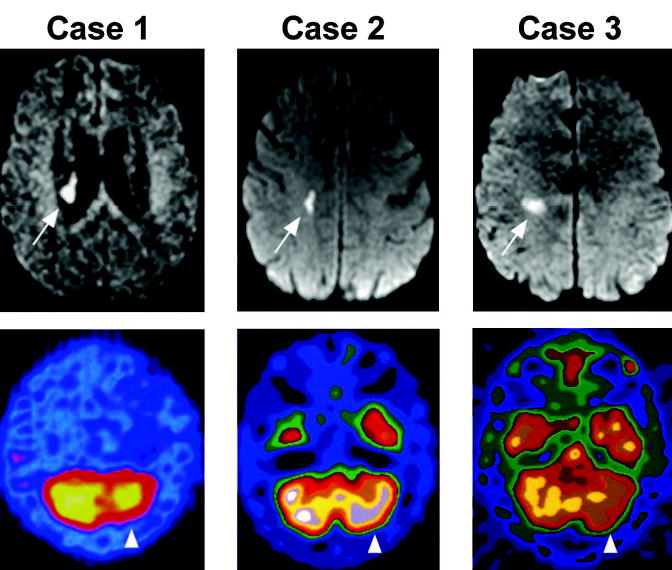
DWI (black and white panels) and [99mTc]hexamethylpropylenamine oxime SPECT (color panels) from each of the 3 cases (case 1 to case 3). Arrows indicate the region of the infarct detected by DWI, and arrowheads indicate the area of hypoperfusion detected by SPECT. The calculated asymmetry index (affected cerebellar hemisphere SPECT intensity/unaffected cerebellar hemisphere SPECT intensity ×100) was 51.5% in Case 1, 84.8% in Case 2, and 48.7% in Case 3.
