
Figure 1. Chromosomal assemblies compared against HAPPY map data.
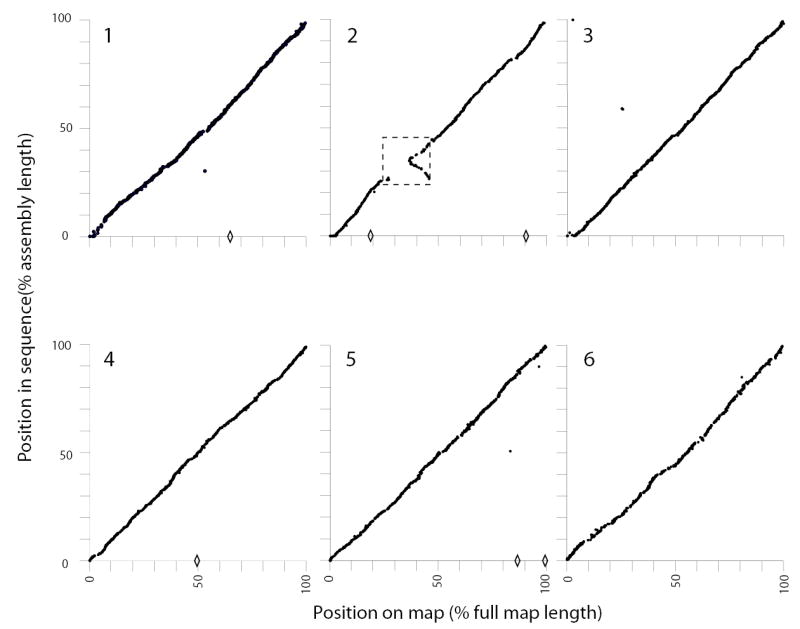
The locations of markers as found in the sequence (vertical axis) are plotted against their location in HAPPY maps (horizontal axis) for chromosomes 1–6. Markers mapped to one chromosome but found in the assembled sequence of another are indicated by diamonds on the horizontal axis. The dashed box indicates a large inverted duplication on Chr2: markers in this region are shown at one of their two possible map locations but are found at two points in the sequence.