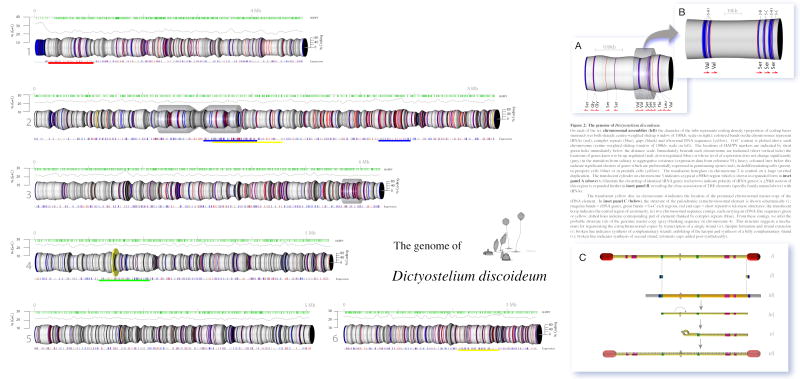
Figure 2. (pullout section) The genome of Dictyostelium discoideum.
On each of the six chromosomal assemblies (left) the diameter of the tube represents coding density (proportion of coding bases summed over both strands; centre-weighted sliding window of 100kb; scale on right); coloured bands on the chromosomes represent tRNAs (red), complex repeats (blue), gaps (black) and ribosomal DNA sequences (yellow). G+C content is plotted above each chromosome (centre-weighted sliding window of 100kb; scale on left). The locations of HAPPY markers are indicated by short green ticks immediately below the distance scale. Immediately beneath each chromosome are indicated (short vertical ticks) the locations of genes known to be up-regulated (red), down-regulated (blue) or whose level of expression does not change significantly (grey) in the transition from solitary to aggregative existence (expression data from reference 91); heavy coloured bars below this indicate significant clusters of genes which are preferentially expressed in germinating spores (red), in dedifferentiating cells (green), in prespore cells (blue) or in prestalk cells (yellow). The translucent hourglass on chromosome 2 is centred on a large inverted duplication. The translucent cylinder on chromosome 3 indicates a typical 300kb region which is shown in expanded form in inset panel A (above) to illustrate the clustering of identical tRNA genes (red arrows indicate polarity of tRNA genes); a 50kb section of this region is expanded further in inset panel B, revealing the close association of TRE elements (specific family named above) with tRNAs.
The translucent yellow disc on chromosome 4 indicates the location of the presumed chromosomal master-copy of the rDNA element. In inset panel C (below), the structure of the palindromic extrachromosomal element is shown schematically (i ; magenta bands = rDNA genes, green bands = G+C-rich regions, red end-caps = short repetitive telomere structures; the translucent hoop indicates the central region of asymmetry. (ii) two chromosomal sequence contigs, each carrying an rDNA-like sequence (green or yellow; dotted lines indicate corresponding part of element) flanked by complex repeats (blue). From these contigs, we infer the probable structure (iii) of the genomic master copy (grey=flanking sequence on chromosome 4). This structure suggests a mechanism for regenerating the extrachromosomal copies by transcription of a single strand (iv), hairpin formation and strand extension (v; broken line indicates synthesis of complementary strand), unfolding of the hairpin and synthesis of a fully complementary strand (vi; broken line indicates synthesis of second strand; telomeric caps added post-synthetically).

