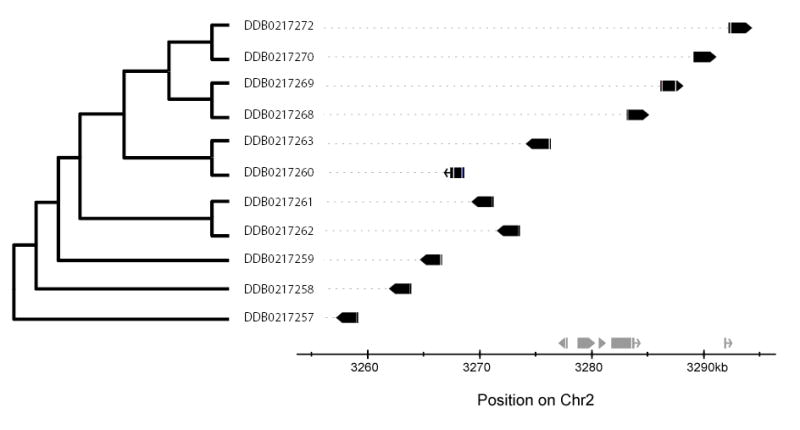
Figure 4. Phylogeny of gene family members compared to their physical order.

The optimally parsimonious phylogenetic tree of 11 Acetyl-CoA synthase genes , computed using the PHYLIP module 'Protpars' (http://evolution.gs.washington.edu/phylip/doc/protpars.html), is shown to the left; dictyBase ID numbers shown at the end of each branch. The graph (right) indicates the arrangement of these genes on chromosome 2 (solid black boxes; gaps indicate introns, pointed heads indicate direction of transcription; chromosomal distance scale at bottom; other unrelated genes in the same region indicated in grey above the X-axis). The correspondence between phylogeny and physical order implies that the cluster has arisen by a series of segmental tandem duplications and local inversions in parallel with sequence divergence.
