Figure 1.

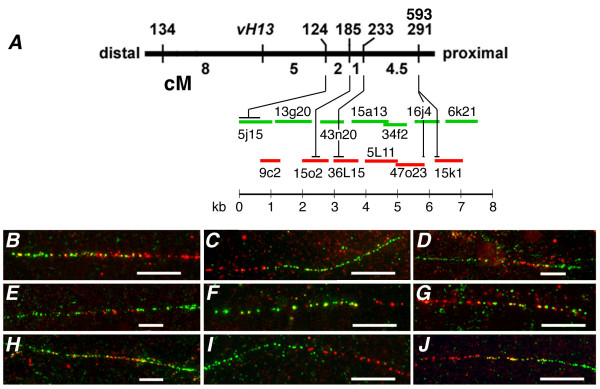
Contig 124-right chromosome walk. (A) Chromosome walking was initiated at STS marker 124 and proceeded 13 steps to the right in reference to the Hessian fly genetic map near avirulence gene vH13 shown as a thick black horizontal line. Vertical lines indicate the genetic positions of Avr gene vH13 and five previously mapped STS markers (134, 124, 185, 233, and 291; Rider et al. 2002) along the genetic map. A sixth marker (593), developed from the end sequence of Mde47o23-SP6, co-segregated with STS 291 in the same mapping population. Units shown below the genetic map are Kosambi centiMorgans (cM). Horizontal green and red lines shown below the genetic map represent BAC clones in the 124-right contig. The line colors correspond to the color the clones fluoresced in Fiber-FISH experiments (B-J). The scale (in kb) shown below these lines indicates the approximate length of each of these clones in the contig. The length of each clone and its overlap with flanking clones was determined by these experiments. Horizontal black lines shown above the BAC clones in the contig indicate the approximate positions of the STS markers in the contig. (B-J) The fluorescence observed at the intersection of adjacent BAC clones (shown in A) on single DNA fibers. The length of the white bars is 10 μm. B) clones Mde5j15 (green) and Hf9c2 (red), C) clones Hf9c2 (red) and Hf13g20 (green), D) clones Hf13g20 (green), Mde15o2 (red), and Mde43n20 (green), E) Mde43n20 (green), Mde36L15 (red), and Hf15a13 (green), F) clones Hf15a13 (green), and Hf5L11 (red), G) clones Hf5L11 (red), and Mde34f2 (green), H) clones Mde34f2 (green), Mde47o23 (red), and Hf16j4 (green), I) Hf16j4 (green), and Hf15k1 (red), and J) Hf15k1 (red), and Hf6k21 (green).
