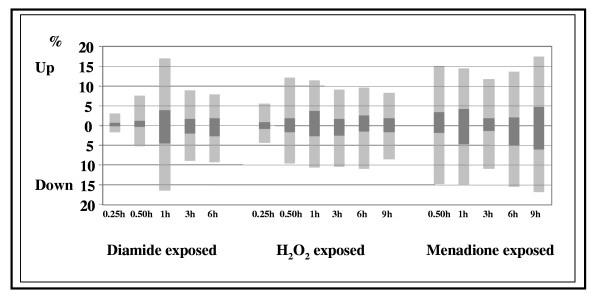
Figure 4.
Ratios of gene probes with at least more than two-fold induction or repression. Global gene expression changes were recorded on DNA microarrays and are presented here as a function of oxidative stress-inducing agents and exposure times. Dark and light gray colors indicate the percentage of affected gene probes obeying either [+2;-2] (four-fold transcriptional change) or [+1;-1] (two-fold change) M' thresholds criteria, respectively.

