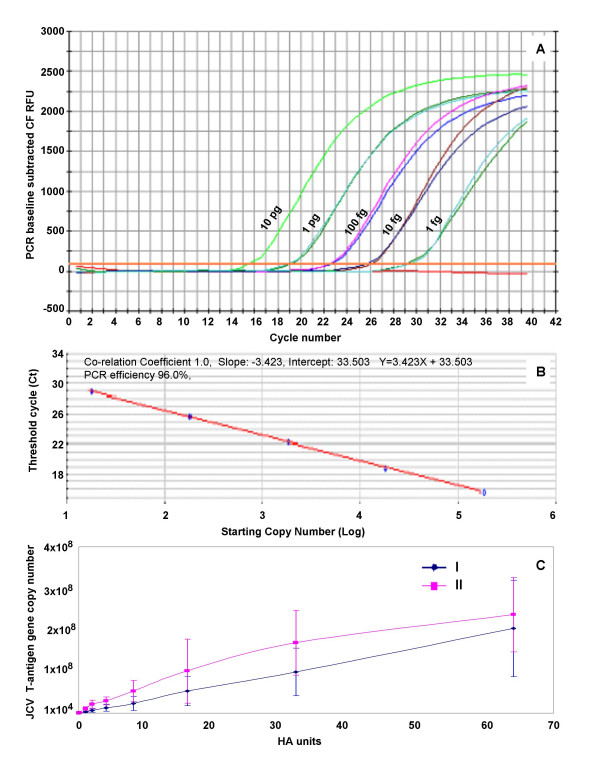
Figure 1.
A – C: Analysis of HA and quantitative real-time PCR data employed for the determination of JC viral load. JCV (Mad1), propagated in Dr. Walker's laboratory (I) or propagated at the RRL (II) was serially diluted with DMEM to make 100 μl of viral suspension containing 64 HAU to 0.001 HAU of JCV. DNA was extracted using a QIAprep Miniprep Spin Kit and eluted in 50 μl of the elution buffer. Two μl of the 1:10 diluted template DNA was used for PCR in a final volume of 20 μl of PCR mixture. Copies of JCV(Mad1) T antigen gene were calculated from the standard curve and were expressed as copies of viral DNA per 100 μl of suspension. A) Amplification plots of relative fluorescence units (RFU) vs. cycle number of the JCV T antigen gene in known amounts of JCV plasmid DNA, ranging from 10 pg to 1 fg in decreasing 1:10 serial dilutions. B) Standard curve plot of the log of plasmid copy number against cycle threshold (Ct), where Ct is defined as the first cycle in which amplification signal is detected over mean baseline signal. The slope was -3.32 and r2 = 1.00. C) The data representative of two independent experiments with samples tested in triplicate for each run of real-time PCR. Standard error bars are represented as standard deviation. The slopes were Y = 3 × 10⁶X - 350714 and Y = 4 × 10⁶X + 1 × 10⁷ and the r2 were 1.0 and 0.95 for JCV(Mad1) virus stocks I and II, respectively.

