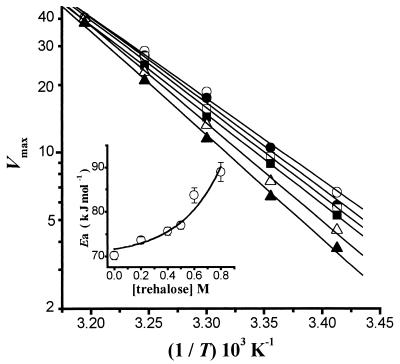
FIG. 3.
Arrhenius plot for the plasma membrane H+-ATPase in the presence of different concentrations of trehalose. The points are the calculated Vmax at each trehalose concentration and temperature. Trehalose molar concentrations were 0 (○), 0.2 (•), 0.4 (□), 0.5 (▪), 0.6 (▵), and 0.8 (▴). The lines were obtained by linear regression. (Inset) Plot of the energy of activation (Ea) versus trehalose concentration. Ea values were calculated from the line slopes as described by the Arrhenius equation (equation 3), and the line was the result of the fitting as described for Fig. 1C.

