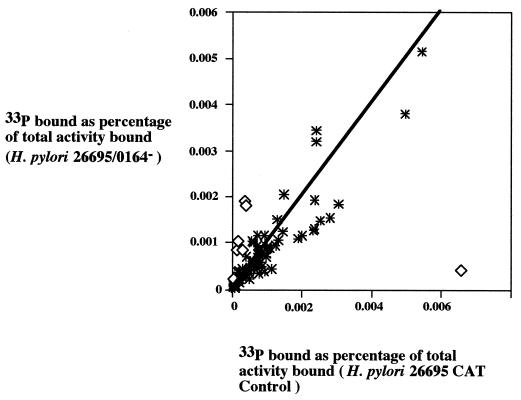
FIG. 3.
Correlation between message abundance in H. pylori 26695 CAT Control and the isogenic HK0164 null mutant. Identical arrays were probed with 33P-labeled cDNA from H. pylori 26695 CAT Control and an isogenic HK0164 mutant strain, as shown in Fig. 2. The scatter plot depicts normalized 33P signals for 88 H. pylori genes. Signals obtained with cDNA from the H. pylori CAT Control strain are shown on the horizontal axis (as a percentage of total 33P bound to the array), and signals with cDNA from H. pylori 26695/HK0164− are shown on the vertical axis. The diagonal line represents the ratio of the two signals as 1. Asterisks depict signals for 81 arbitrarily selected housekeeping genes that were transcribed at similar levels in H. pylori 26695 CAT Control and H. pylori 26695/HK0164−. Open diamonds depict signals for genes identified as differentially transcribed in the two strains. The results shown here are representative of results of three independent experiments.

