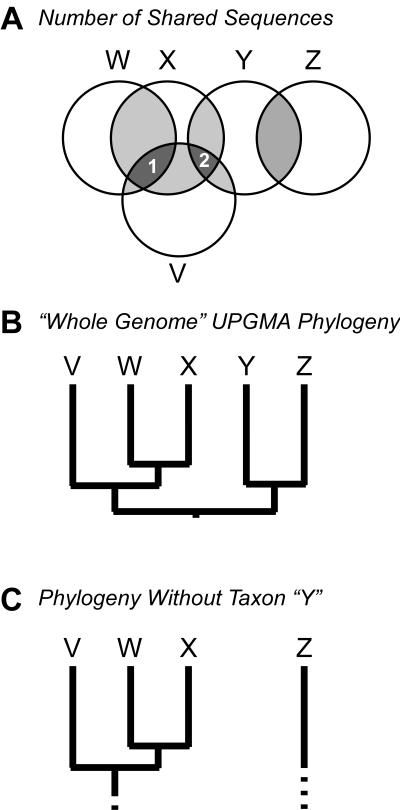
FIG. 5.
Problems arising in using phenetic methods for bacteriophage taxonomy. (A) Relationships inferred from overall similarity (e.g., number of shared genes, DNA sequence similarity, DNA-DNA hybridization, proteomic overlap) are here depicted in a Venn (141) diagram. These data can be misleading in two ways (see the text). (B) A phylogeny is drawn for all taxa in part A by using the robust phenetic approach UPGMA (122, 127). (C) Relationships are contingent upon the taxa included in the analysis; here, the elimination of taxon “Y” eliminates the connection between taxon “Z” and the remaining taxa.

