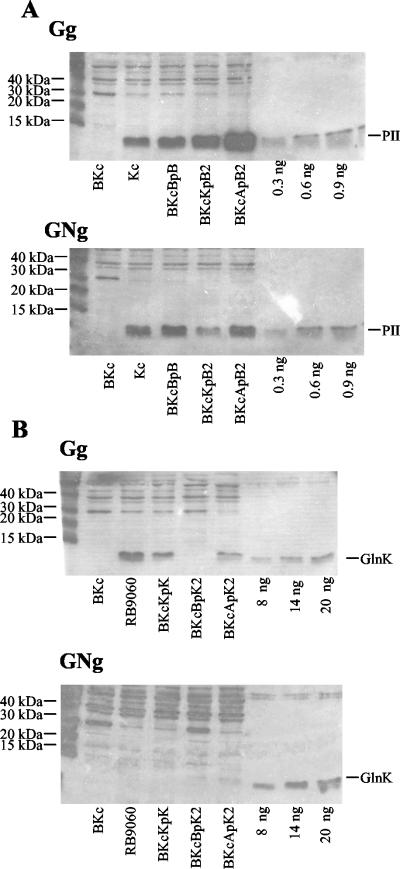
FIG. 4.
Immunoblot analysis of PII and GlnK expression from various promoters. Cells were grown on different media (Gg, glucose-glutamine medium [nitrogen limiting]; GNg, glucose-ammonia-glutamine medium [nitrogen excess]) to an optical density at 600 nm of 0.5. An aliquot of each culture was assayed for GS activity; results similar to those shown in Table 3 were obtained (data not shown). Cells from 1 ml of culture were pelleted, frozen at −20°C, resuspended in 0.9% NaCl, and disrupted by sonication. Protein concentrations were determined by the method of Lowry et al., and 6 μg (A) or 10 μg (B) of each extract was used. Electrophoresis was on sodium dodecyl sulfate-16% polyacrylamide gels. (A) Expression of PII from various promoters in cells lacking GlnK. (B) Expression of GlnK from various promoters in cells lacking PII. The source of each extract is shown at the bottom. The leftmost lanes contained electrophoresis size standards; the three rightmost lanes on each blot contained different amounts of purified PII (A) or GlnK (B). The positions of the PII and GlnK bands are indicated on the right.

